The Markets on Mon, had a decent sort of push to the upside. The NASDAQ lead the way higher, The Dow Jones was marginally higher. The Mega Caps were not necessarily the story on Mon but, it was all about some other things like some M&A activity. We could also see a nice recovery from some beaten down Bank stocks.
The Dow Jones S&P and NASDAQ Market Movement
On a day like Mon, again it was a a sideways choppy environment. Mondays market traded with lower volatility with tendencies of higher drift but, again there were a couple of interesting observations about Mondays action. Number one, materials was the number one sector as there’s some eminent activity with Newmont Mining and a couple of others involved. This is causing some of those stocks to move to the upside.
Next, Mega Cap, Tech Communications, and some names of those Fang Stocks, wherein not all of them were having a particularly good day on Mon. While the markets were actually pushing higher, some of the Fang stocks were actually down on Mon, Mondays trade happening was therefore a bit of a different narrative than we’ve seen from recent weeks.
However, the general theme is still the same as we wonder, Can these stocks OR Can these indexes get above resistance levels ?. For now we’re still waiting, although we’re finding more and more individual stocks that are still able to do well. We’ll try to highlight some of these exception stocks here today as well.
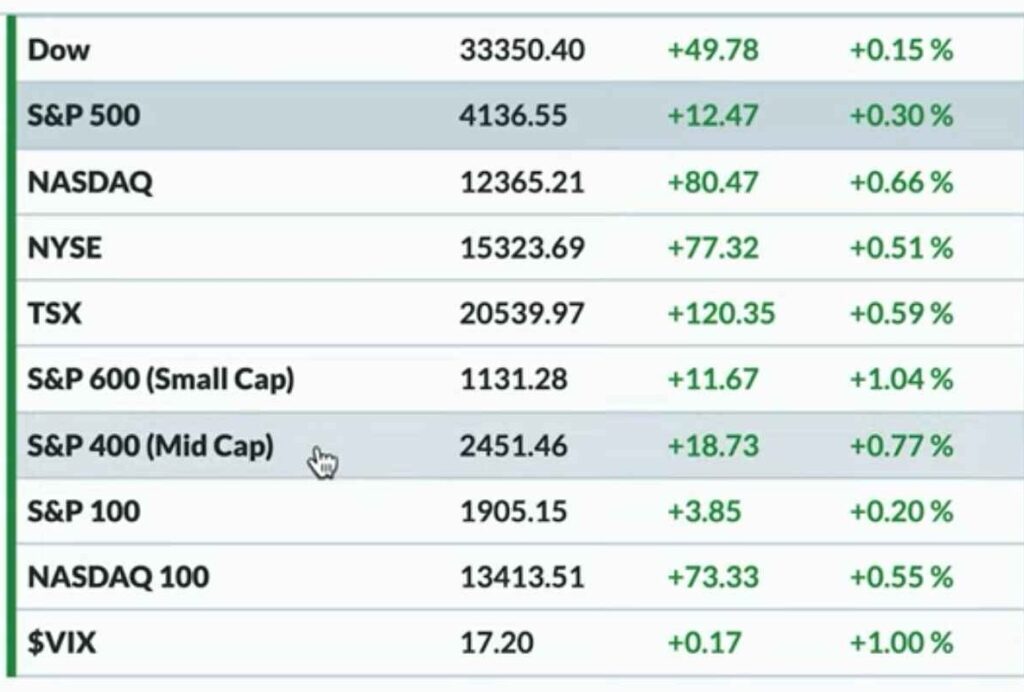
In our Market Recap for Mon, we observed that throughout the course of the day, the Major Averages had a decent move to the upside. By the end of the day, the Dow Jones Industrial Average was up by 48 points to 33,348.6. The S&P and the NASDAQ finished towards the highs of the day. S&P was up about a 0.30 percent, the NASDAQ Composite was up 0.60 percent.
We find that, while continuing to push higher on Mon, as the NASDAQ Composite has made a new high for the year but, the S&P is still not quite there to a 43200 sort of that main level we’re looking for. If and when the S&P can get above 43200, which we think, undeniably at some point, it will do, we just don’t know if that’s tomorrow or a longer wait off. However, for now we haven’t quite done it yet, but again underneath the hood we are finding some interesting movements, which again we’ll try to highlight here through our Recap.
Mid Caps and Small caps were up as well. Another bit of a diversion from the recent narratives that we’ve been talking about is Small Caps. Small Caps actually outperformed on Mon. The Small Cap S&P 600 index was up about 1 percent.
The VIX and the Relative Movement of Dow Jones S&P NASDAQ
The VIX moved higher as well. So Mon was one of those unusual days where we had the market moving higher and volatility increasing. This is a very less common phenomena. Markets tend to move lower on higher volatility because we always think of volatility which is the VIX as a fear gauge or as a measure of uncertainty. Therefore, generally speaking, markets tend to move higher on Lower volatility and they tend to move lower on higher volatility, but for Mon, the VIX actually pushed just a little bit to the upside, or just above 17.
Bonds
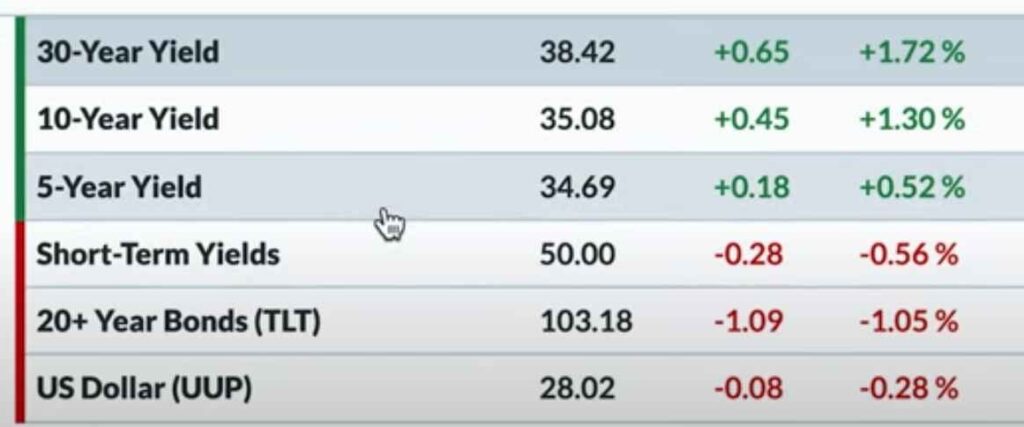
As we look at the yield curve and talk about the Fixed Income Markets of 5,10,30-year yield points, all of these moved a little bit higher. What that means is, basically bond prices came down.
The TLT which is fourth or the fifth on the Yield list was down about 1 percent to 103.20, A little bit below there we have 5, 10, 30-year yields which all moved Higher. The 10-year yield was back above 350 to around 351. The Dollar Index was down by about 0.30 percent. This is not too much to the downside.
The Dollar would be something that we keep an eye upon, because any big uptick that we ever see in the dollar, may probably not be a great sign for stocks. This again is a pretty big generalization.
Commodity
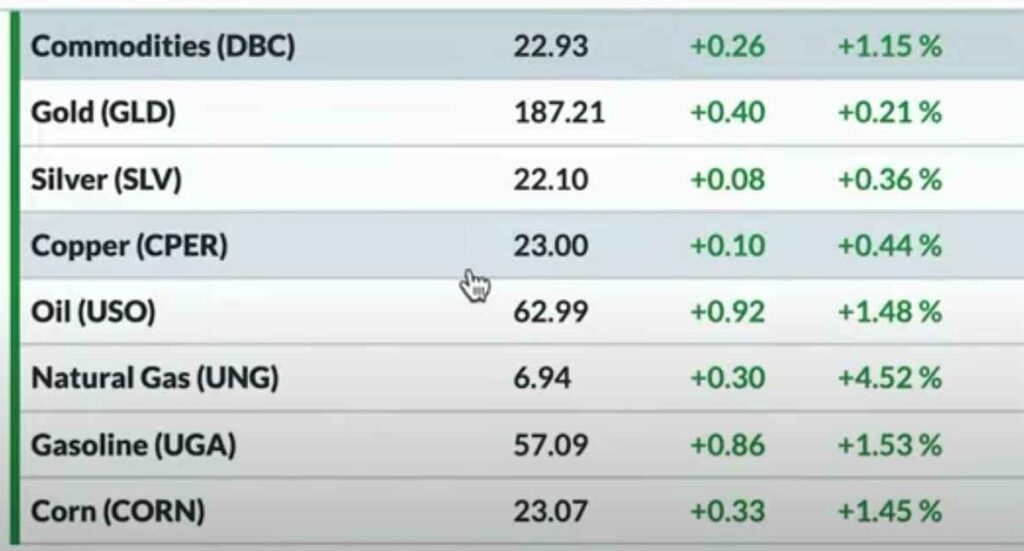
For Commodities, there was overall a lot of green, on its list. The DBC, which is a broad commodity ETF, was up about 1.1 percent. Gold and Silver prices both moved to the upside but not by much. Crude Oil prices had a decent day with the USO up 1.5 percent, Natural Gas was the best performer out of this group of eight commodity ETFs.
Cryptocurrency
Finally in Cryptocurrencies, on Mon, we saw them pushing to the upside. Bitcoin was up 1.8 percent from Sunday’s end of day and then Ethereum price is just around 1830.
Sector Performance
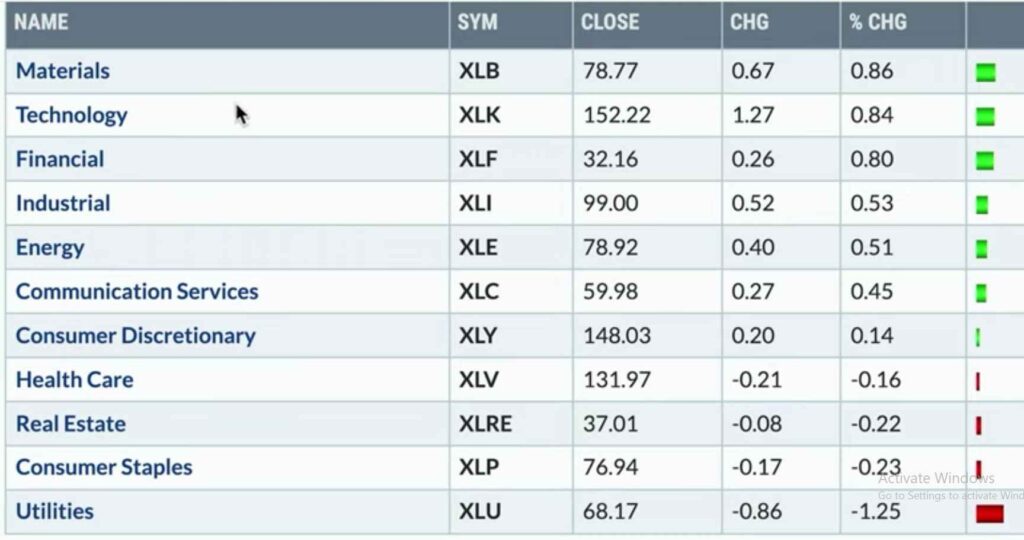
Sector wise, especially as we look at the sectors that moved, we had Materials actually number one. That’s actually pretty uncommon, as it has been a long while, since we haven’t had materials at the top of the list, that any of us can remember.
We may have talked about the strength in Gold stocks and some of the precious metals names but, as a Sector, Materials has not been particularly a leading sector and it’s usually been some of the more defensive ones like Healthcare, Real Estate or something more growthy like a Technology or Consumer Discretionary that we were always focused upon.
On Mon, the Materials or XLB was the top performing ETF and just narrowly edging out the XLK or Technology and Financials. All of these 3 sectors were up about 0.8 to 0.9 percent. On the downside, we had the defensive sectors that were down for most of them. Down here, Utilities was down the most, around 1.25 percent, Consumer Staples, Real Estate, Healthcare were down about 0.20 to 0.30 percent.
Stock Watch Away from Dow Jones S&P NASDAQ
As we were scanning for ETFs that made new three-month highs and three month lows, we came up with non-US stock, EWJ. EWJ has a nice breakout above resistance and can continue to hold 59. That’s a pretty strong stock and maybe a good opportunity to diversify away from the US.
Another non-US name is Telefonica, Brasil or VIV, that broke above the 200-day moving average. Another stock Danaher DHR, this is a medical equipment name that is actually making a new three-month low.
As we read through the weekly stats of the S&P, DHR shows a rotation from a rally that it went into, in the third quarter of 21, and now to more of a Downtrend.
Danaher has now broken down through support, further breaking down through the 150 week moving average. Therefore, overall Danaher is a beautiful illustration of a rotation from an accumulation phase to more of a distribution phase. It will be interesting to watch out for that Trend to change before we get too excited about the upside potential in a stock like Danaher.