We welcome back from the long holiday weekend. Today we’ll talk about this narrow leadership Trend that continues with the small number of names where the largest names doing the Lion’s Share of the Gains on the Major Indexes( Dow Jones, S&P, NASDAQ)
We’re in this interesting situation where Trends just come to seem, to keep persisting. With some of the leadership names like Nvidia and the Fang stocks continuing to push higher, its a bit of a concerning candle pattern on some of those leading names, which we’ll talk about through the course of this article today.
Overall, a lot feels like, a little bit like the late 90s. It feel like if anyone adds AI into their stocks then, that’s an easy 5 to 10 percent bounce in their stock these days but, that has to be a little concerning. At the end of the day the stock charts will tell, when a trend like this is working and when it’s no longer working, so the best argument we think we have in these sort of markets is to follow the trends because using the trends, we’ve certainly seen where stocks could be, finally and mostly.
Lets share with you an analysis of some of the stocks charts and some of the movements in the fixed income markets as well.
Market Recap – Dow Jones S&P NASDAQ Mid & Small Caps
In the S&P, we still see that leadership but, what’s so interesting is that, at the end of the day, we wonder what our major averages did?.
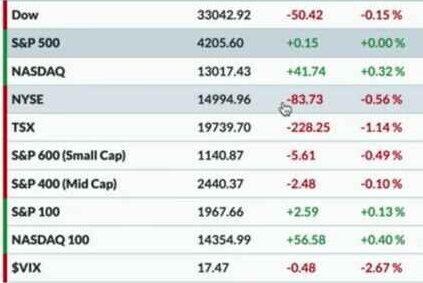
On Tue, we are back to kind of a familiar pattern with the NASDAQ up a bit, the S&P was flat, the Dow Jones Industrial was down a bit, and that’s sort of how the day ended up on Tue. By the close the S&P closed just above 4200, It just narrowly bounced into the close to close the day at 42.05, that’s about where the S&P had started and about where it had ended the day on Friday, before the long holiday weekend that was. The Dow Jones was down just a little bit about 0.2 Percent, the NASDAQ up about 0.30 percent, the NASDAQ Composite was just above 13000.
Mid Caps were down, Small Caps were down, with probably the most of this group being down about 0.50 percent.
The VIX
The VIX moved lower as well, therefore we had a choppy sort of session with volatility coming in and again we have an open question about what the VIX is likely to be, going forward. We have a lot of data about what the VIX has been.
Now that we have the Options Market changing, we’ve got the zero DTE options, we’ve got some other measures of volatility to contend with but, we still have an open question – but what is it worth for ?.
The VIX is currently down around 17.5, which is we know, below volatility. If we had to generally bucket that into “lower high” then it’s certainly Low Volatility, particularly relative to the last 12 to 18 months.
Bonds Gold Silver Dollar
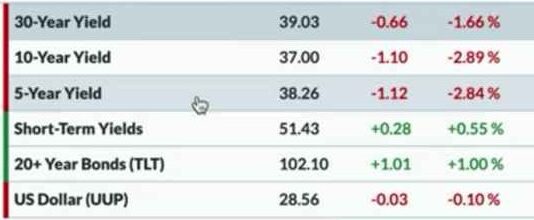
As we look at some other Asset Classes, the Interest Rates overall moved lower. On Tue, 5, 10, 30-year points all pushed to the downside, 10-year yield finished around 3.7 percent, long bond yield around 3.9 percent. Last week, we had rates pushing a little bit higher, with long bond yield around four percent, but now this has come back, a little bit, from where we were.
As bond prices moved higher, the TLT which is a treasury bond ETF or a sort of long Bond ETF, was up about 1 percent.
The Dollar Index did not see too much of a change from Fridays close, and again that’s using the ETF space UUP which was the ticker there. Whilst looking at Commodities, Gold was up, everything else was lower. Energy continued to be one of the worst performing sectors.
Year-to-date, Energy has certainly been one of the worst places as we know, relative to previous parts of the cycle, where it’s been particularly strong but Energy for now has been struggling.
Gold actually working now. Gold and Gold stocks have been pulling back quite a bit here in the last couple of weeks.
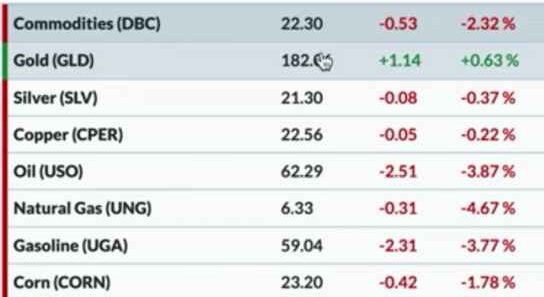
Arguably one could make the argument that Gold is at the lower end of a trend Channel, because it has come off of the the lows but, that’s going to make sense if gold rallies from here. Tue saw a bit of it but, we’ll have to see if there’s more for that game or, if that would probably be more of a defensive play. Our guess is, if the growthy indexes start to come down a bit then, we could probably see gold popping.
For Tue, what it was really worth is, gold actually had a decent day. The GLD was up 0.6, Silver was not as much down. It was about 0.40 percent.
Cryptocurrency
Crypto Land was mostly in the green on Tue. There was some choppiness that we saw over the weekend. On Tue, Ether was just above 1900 and that’s up 0.70 percent, Bitcoin was around 27850.
Sectors – Markets Dow Jones S&P NASDAQ
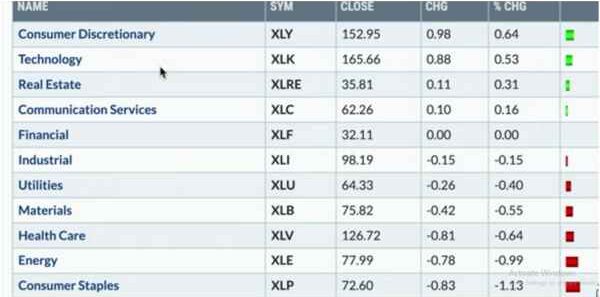
A look at sectors showed Consumer Discretionary, Technology were up in the 1st and 2nd position on Tue. On Tue, XLY and XLK at the top of the list, were followed by Real Estate, which was sort of an interesting third spot from the top because Realty tends to be a little more of a defensive sector.
On the bottom, it was the defense Consumer Staples sector, that was number one at the bottom and the worst performing sector, which was down about 1.1 percent. Therefore, one of the classic measures of offense over defense that we look at now is, Consumer Discretionary Vs Consumer Staples (Things that you want, over things that you need today, for what it’s worth very much).
In our bet of Offense over Defense, we find that this ratio has certainly been dipping higher, after going down. This certainly did not support the uptrend that we’d seen in the equity indexes, but now, its starting to rotate higher and that’s been a reverse that we’ve seen over the last month or so, and we see a bit of a rotation back to Consumer Discretionary and away from Staples, and a lot of that are stocks like Coke and Pepsi and PG and and others rotating off of their previous swing highs.
Stock Watch Markets Dow Jones S&P NASDAQ
Stock Watch Here’s the performance of three ETFs, since the peak in February of this year. The S&P from the February Peak was about 1.2 percent higher and was again sort of chopping around here, in the last month or so, but is overall up about 1.2 percent.
The NASDAQ 100, the Qs up 12.50 percent, the equal weighted S&P is actually down 8.7 percent over that same time period, so if it feels like your portfolio doesn’t look like the chart of Nvidia, then it may be because you’re holding anything but those NASDAQ 100 Names. The rest of the market overall has been sort of flat to quite challenged.
Another Stock chart that one would argue of having sort of a cup and handle like bottoming pattern is DVN or Devon Energy Corp. Arguably for DVN, it’s after a pretty good sell-off through the middle of 2022, we had seen a double bottoming pattern.
We know that it bottomed in the end of October, rotated Higher with a clear higher low, that was really close to Breaking above resistance of around 45, and with relatives strong, and with outperformance, we would say DVN is a pretty constructive stock.
Finally a stock that we are just calling three candles is, NVIDIA on the top, Apple in the middle, Amazon on the bottom. We want to highlight the fact that all three of these stocks gave a bearish candle pattern on Tue, It could be some short-term weakness in some of these leadership names and these were showing a bearish candle pattern on Tue.