Image by Antoni Shkraba: https://www.pexels.com/photo/a-man-discussing-using-a-laptop-5583975/
Friday Market Recap – Dow Jones and Other Major Indices
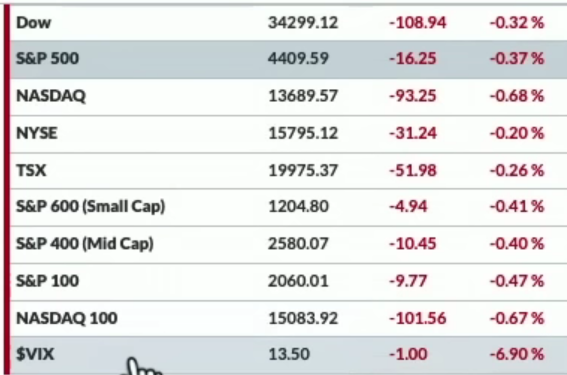
As we wrap the week, by looking at what what happened on Fri in the markets, the Dow Jones closed 108 points lower, down by 0.30 percent, the S&P was down just over 0.30 percent and still stayed above 4400, to finish just below 4410. The NASDAQ sort of doubled that negative move and was down about 0.70 percent, thereby pushing the NASDAQ Composite down below 13700.
Mid Caps and Small Caps were all down and all the three captors namely Large, Mid and Small were all around the same, down by 4.4 percent. There was not a huge sell-off but of course, it’s unusual as it has been unusual that we’ve seen all Reds on the market dashboard anytime recently on the front page, whilst looking at the Major Equity Benchmark. Let us not draw too many long-term conclusions about short-term data but, it’s however interesting to us, here on a quad witching day that we are getting a bit of a rotation to the downside.

The VIX again came down lower on Fri. On Thu, we had stronger stocks, stronger VIX but, on Fri we had the opposite i.e. lower stocks lower volatility. The VIX was down a full point to around 13.50. The range of the VIX In 2023 looks a lot like 2021 where we see that slow and steady gain on Lower volatility and arguably until that changes this sort of slow and steady increase that we’ve seen is probably still in play. On a day like Friday this maybe the beginning but we will have to see more of a follow through on next week.
Bonds

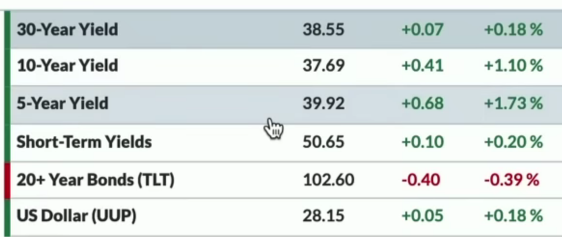
Continuing on with some other Asset classes, as we look at the fixed income markets we could see the 10-year yields currently at around 377 and the 5-year yield to be just below 4 percent. Tenure yield was around 386. Long buy or short-term yields were again still higher, Therefore, this inverted yield curve tends to be a pretty classic sign of a recessionary period but, for Fri most of the yield curve pushed a little bit to the upside. Bond prices of course are going down, with the TLT down about 0.40 percent. Dollar did not have too much of a change from yesterday.
Commodity

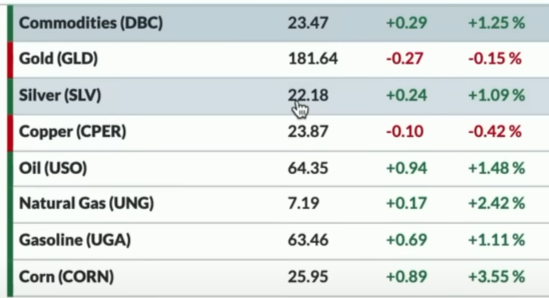
While looking at the Commodity space, it was a little bit mixed. The DBC, which is a broader commodity ETF, was up about 1.25 percent, Crude Oil prices were up about 1.50 percent, Natural gas was up even more about 2.50 percent. Copper was down, Silver was up and Gold sort of flat for the day on Fri. While talking about Commodities and about what’s just happened with materials and energy and the likelihood of their rotation to the upside would be dependent upon the proof of price and more particularly upon the relative strength, which is still fairly weak for these particular sectors.
Cryptocurrency
We saw Bitcoin with a little spike higher and that was when the news hit about the ishares ETF being filed. Bitcoin and Ether were both up about 3 percent on Fri and Bitcoin currently was around 26325.
Weekly Update – Dow Jones Other Major Indices Bonds Commodity
Weekly Recap In the Weekly Market Recap, as we compare and try to understand, what happened from last Friday’s close to this Friday’s close, firstly the S&P had a pretty strong week. Even with this Fridays pullback, the S&P finished the week just briefly overall, and was still up 2.6 percent for the week. This was certainly one of the better weeks that we have seen for S&P. Even the Emerging Markets were having about the same return for the S&P, through the course of the last five trading days. We had the NASDAQ 100 again with those bearing the leadership areas of the market and continuing to remain strong during this week.
The QQQ was up 3.8 Percent in comparison to last week. The Crude Oil or the USO had a nice couple of trading days in this week and therefore it finally finished the week up about 2.3 percent and got above some of the others that it had been lagging behind through the course of the week.
Bond Prices this week is up about 0.7 percent, Small Cap stocks was up about 0.50 Percent this week. Everything else was down for the week. Gold essentially was flat this week. It was down 0.20 percent this week and therefore it did not change much from last week. Bitcoin with the nice bounce over the last couple of days was still down about 0.60 percent and that’s a nice recovery from midweek when it was down about 5 percent. The Dollar, this week was the worst performer and down about 1.2 percent.
Again, in this classic relationship, a big strong Dollar has tended to dominate other assets and has been more of a risk-off field this week. It’s been a little more risk-on for sure, with leading stocks continuing to push to the upside and therefore a nice week overall for stocks and for some other assets as well.
Fridays Market and The Long Term Take
While reading the S&P chart for Friday, to see what this day meant for the longer term, we see that the S&P again opened higher and we made another high intraday high for the year but, we went below Thursday’s close.
Overall, we find that the run has been exceptional and the strength and the move off of the swing low in March has been impressive, particularly when we see how we’ve followed through after breaking through 4200 and then breaking through 4300.
Now we are above 4400 and touching 4450 on Fri. Therefore, when we think about sustainability there are two things that we can look at. Firstly, when the market is over extended as defined by a momentum indicator like RSI still currently overbought which just means we’ve gone up a ton and Secondly, it would be some sort of a confirmation with something like a MACD giving a sell signal which would tell us that a rotation lower is now in play.
The next question that pops up is, upto which level do we pull back to?. We think the short term supports 4300. A key resistance level often becomes the target of a short-term sort of Switchback, so we would look for 4300 as a potential support level, incase if we ever rotate lower through the course of coming Week. Now, further below, we have the 50-day moving averages below 4200. We think this is sort of the ultimate level and as long as we remain above this trend line connecting the October and March lows, overall this uptrend is still pretty fair. This means we can have about a 10 percent drop down to around 4050 and still be within the context of a fairly consistent bull market.
Now, that’s exactly what we’ve seen right now with the chart of Gold here because when we think about Gold, this is a trend that’s been overall very strong however, We are now at the lower end of that channel and arguably we may be bouncing higher here. We’ve broken below the trend line Channel but, we are now holding 180. The 180 dollars on the GLD, lines up pretty well with the January rally, the January February Peak and this holds.
Therefore, we think a number of these things have pulled back like Gold but, Are they holding support?. Things like the S&P have not pulled back yet but, if and when they do we think we have some ideas about a potential downside objective.
Market Trend – Dow Jones Other Major Indices and Sectors
Regarding the current Market Trend, we talk about the strength in this Week gone by. The S&P was up over 2.50 percent with a nice follow-through. How do we now know that a top has Happened?.
There are 2 things to consider here. No.1 is that there is no denying that, we are over extended by every measure of the Price momentum, by breadth characteristics, by just a movements away from a mean price percent above a moving average. All of these tell us that the market has had an incredible run already.
The Second thing though and a very important thing to look for are signs that the rotation is beginning and we think that is what we have not seen really yet, in any meaningful way. We are seeing all little bits and pieces like a random bearish momentum Divergence, but not to the scale that it seems like a really obvious rotation lower.
We feel, going into next week, we will watch some of those leading names like Apple and Microsoft and some other top ranked names like PLTR, to see if we start to get that rotation, see if we make a new high on Lower volatility. That is what would tell us to start to really get concerned but, for now the trend is positive and the way we define that is with our market Trend model on a long term medium term and short-term basis. Yet again, this week is all thumbs up and all bullish.
Next, Gold GLD has bounced off of 180 and it had basically found that at the end of May, It has now been a couple of more times that it has bounced off of that support level. it’s interesting to us because it lines up with the January high and if you look at its rally into the August peak of last year then, we have made a new low for the year, retested it as resistance broke above, and then tested it from bottom. We bounced off of that call 167,..168 level but, that was for rotating higher. We have now done that same pattern, involving the January Peak, then the breakout and now the retest. We would be very keen to see if 180 holds and if so, this could be a really interesting setup.
Gold is more of a defensive play so we could see leading growth stocks struggling a bit or pulling back and something like Gold really taking its place, in a position of leadership.


