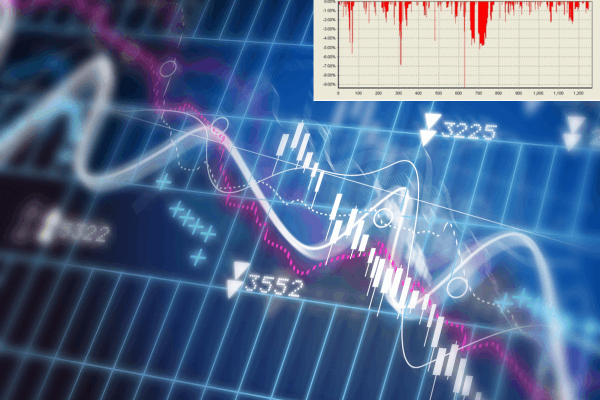
Image by Gerd Altmann from Pixabay
Tuesday Market Recap – Dow Jones and Other Major Indices
Presently, we are very well seeing a sort of a risk off Positioning in the markets. Last Friday, we saw the rotation lower, Monday of course was a U.S holiday and then Tuesday we were back to trading a Gap lower. Earlier in the day on Tue, we saw that the markets were sort of rallying midday. Even though the XLY had a pretty decent update, the weakness in Materials and Energy, really pushed the markets like S&P, Dow Jones and others lower.
What we learnt in terms of the price action on Tuesday was that, the markets were a little bit weaker. We had continued on the market weakness that we saw on Friday and now we have charted this sort of exceptional run in the leadership of the markets within those growth oriented sectors like Technology and Communication Services. Now, one of those Consumer Discretionary is having a nice update and is up about 0.75 percent but, the average stock was struggling a little bit on Tue. We wonder if this is the beginning of maybe the seasonal weakness that usually happens from June into July for the S&P 500 and the NASDAQ but, that remains to be seen.
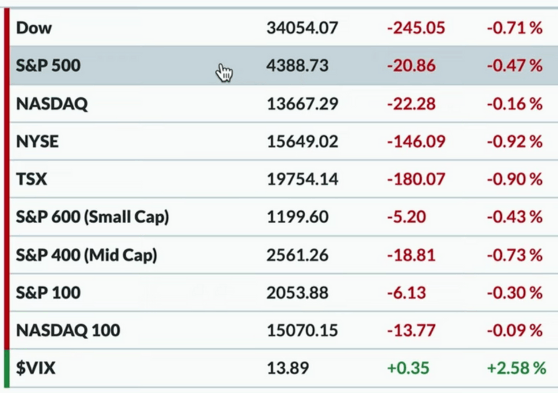
In our Market Recap, as we mentioned, it was a bit of a risk-off feel to things on Tuesday. The S&P finished the day down about 0.50 percent and it wasn’t an end of the world day but, certainly there was no bullish follow-through. That’s a real difference from what we’ve seen with some of the leading names like Nvidia, Apple, Microsoft and a lot of similar sort of Large Cap growth stocks that had such strong runs. What we are looking for now is, once we have an established Trend like the one we already have, we look for signs that this trend is or maybe changing.
For Tue, the S&P was down about 0.50 percent. We would want to see much more than this, to start becoming really skeptical of the trend reversing or skeptical of the trend continuing, but for now that’s where we’re at, just below 4390 and therefore back below 4400 for the S&P 500. The NASDAQ Composite was down about 0.20 percent. We had the Dow Jones down 0.70 percent and pretty much everything else in the red as well on Tue. Even the Mega Cap S&P 100, the NASDAQ 100 were still about flat for the day and NASDAQ 100 was still above 15 000.
The Volatility In Dow Jones and Other Markets
Volatility popped up a little bit, but was still very very low. if it’s around 14 or 13 then, it is deemed to be exceptionally low. if we look at the last 18 months as a sort of frame of reference. When we go back a little further to 2021, we can see what a long-term bull face starts to look like. 2021 was an extended uptrend, a consistent move of higher highs and higher lows, minimal drawdowns and pretty low volatility. Now, we are actually back in that similar range. We are actually in the low end of the range that we saw in 2021 and that you know maybe noteworthy.
Bonds
As we look at some other Asset Classes, if we are asked about growth stocks and the growth leadership and what would tell us that the bullish phase is now exhausted then, one of the things we would look for is risk off positioning or defensive positioning. This is basically when people tend to go to the relative fetal position of trying to find something to ride out periods of uncertainty. Such similar places that one would tend to think of would be, the bond markets and then hard assets like gold and silver.
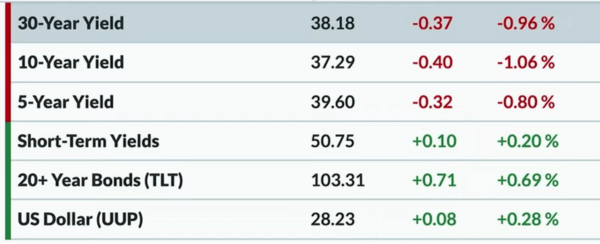
Bond price actually moved higher. While stocks had come off on Tue, the TLT which is a long Bond ETF actually moved higher by about 0.70 percent. We could see the yield curve of course, moving lower so when bond prices are going higher that means yields are actually rotating lower. The 10-year yield is down to around 373. Not too far above that was the long bond yield which was around 382.
Dollar Index was up by about 0.25 percent. Dollar might be another thing to look at because, of the dollar Index potentially making a sort of double bottom of sorts here in 2023. We will wait to see if we get a further rally to the Upside. The story of 2022 was more of a risk off, with the dollar strong and everything else being pretty much down. Therefore now, are we likely to see an improvement in the Dollar and then a move lower for the impending risk assets?. It maybe a start of that phase, but not enough though as we feel, to really move the needle in that Direction.
Commodity
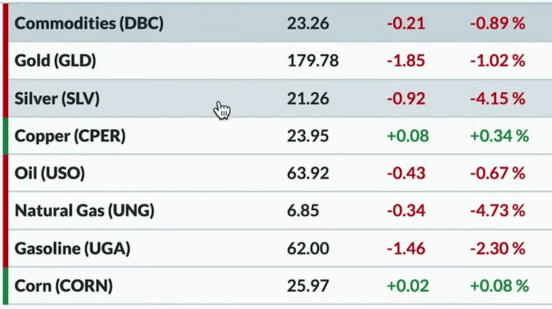
Speaking of Commodities and the red color, we had Gold and Silver both moving to the downside. The GLD was down about 1 percent. In our report last week, we covered about the chart of gold and the sort of trend channel that we’ve seen on gold prices and other precious metals as well. We are now breaking below the lower end of that Trend Channel. The same can be said for Silver that was actually down 4 percent on Tue, that’s using the SLV. Some of the Commodity ETFs were up just slightly, but overall the Commodity complex was weaker. Oil Prices moved down as well. The Energy sector struggled quite a bit.
Cryptocurrencies
As regards Cryptocurrencies, we always say that, if you enjoy Volatility and Uncertainty then, you would probably love the Crypto world because there are a lot of sudden movements. In the last couple of weeks. We have seen all sorts of news flow, both bullish and bearish for major Cryptocurrencies. On Tue, Bitcoin was actually up about 4.3 percent or we can call it just below 28000 right now. In the past, it was a big significant level of 30000, where we had traded up to and later we had stalled out and then pushed lower. We are now bouncing off of a key Fibonacci level. Bitcoin, we think is moving very similar to Ethereum right now. Ether was just above 1780 and that’s up 2.6 percent from Fridays close.
Sector Performance
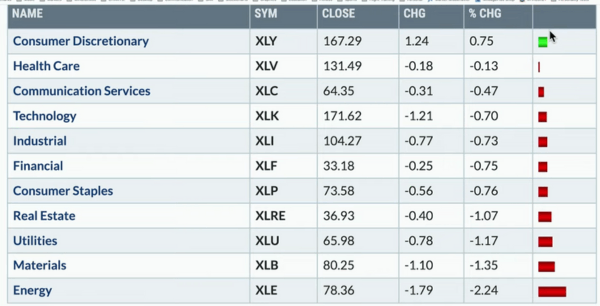
Whilst looking briefly at sectors, as we had mentioned in our intro above, we had the Consumer Discretionary that was pretty much positive but, everything else was in the red. The XLY was up 0.8 percent and we could see that leading names like Tesla had a pretty good day to help the XLY move higher. We have to remember that things like the XLY, the XLK and even The XLE are very top heavy or popular sector ETFs.
When we say they are very very top heavy, we mean that they are heavily weighted to a couple of names, two or three at the most. Therefore, about 50 percent of the XLY is Amazon, Tesla, Home Depot. About 50 percent of the XLK is Apple and Microsoft and that is a good thing, when those stocks are doing well but, if and when those stocks start to struggle the whole ETF basically gets dragged down because those Mega cap names might be struggling a bit.
The XLY on Tue, had a nice update, but everything else was flat to down. Healthcare was no. 2 and then Communication Services and Healthcare not far away from being up on the day on the downside and this is what really hurt the S&P. The XLE or the Energy sector was down 2.3 percent. The XLB or Materials was down 1.4 percent as well. Utilities in Real estate, the 2 pretty defensive sectors were down as well. Therefore, this was not a big flood-to-the-exits risk off type of move, but more kind of everything, barring the XLY which had a bit of a rough go at it on Tue.
Trend and Stock Watch Over Dow Jones S&P and Other Markets
No. 1, we talk about the SMH or Semiconductor ETF, about their growth space and Leadership and Large Cap growth and wonder if we have now seen the end of it. Our take on this is, all of those names are overbought and the markets themselves are overbought and we would be concerned about the potential upside from here. However, There is no denying that the trends have been strong from where they started in October, somewhere in the third or fourth quarter of last year, until where they are at today.
The question is, How much further would we go from here?. When we see a lot of those stocks becoming overbought and when we see things like the SMH, like the S&P, like the NASDAQ facing significant overhead resistance, we tend to be skeptical about further upside from here. In particular, we have always talked about names like Apple and Microsoft and others, where we’ve looked at divergences and how they might play out but, let’s look at the SMH or the semiconductor ETF and the fact that we’ve now round tripped back to all-time highs.
The SMH last made a new all-time high in the fourth quarter of 2021. this is when Semiconductors were really doing well, leading the market higher and it was the Relative Strength that really improved going into the fourth quarter. 2021-2022, that is of course, when the Semiconductor space along with most growth stocks and most stocks in general were struggling in a big time way. That all changed and we could see a head and shoulders bottoming pattern or an inverted Head and Shoulders, that was validated and then we have continued to move higher, higher highs and higher lows. Now those higher highs have reached the all-time high, therefore can Semiconductors continue on without a pause and just blow right to the upside?.
Of course, they can. Is there a much Liker or a much more likely scenario where they at least have a pullback from these levels?. Yes, we would argue that whatever we saw on a day like Tue, could be the beginning of a bit of a deeper drawdown and the market could go higher and the semiconductor space could push higher and the SMH could get above 160. However, a brief pullback, even when we are really bullish on this space, would probably be the most important thing to see because, that could reset this uptrend and put in a big time higher low. This would then become the springboard to make new all-time highs from it. Next, the RSI that was overbought had just come out of that overbought region, on Tuesday. This is an important space to watch certainly through the remainder of this holiday week.
No. 2, we talk about Tesla. The XLY which is the best performing S&P sector today, is no small part, because of Tesla being up over 5 percent, around 275 right now. We were looking at the last two years, to show how extremely overbought Tesla is now. There are 2 things that we would like to say when a stock is extremely overbought. No. 1, that means it’s gone up a ton and that’s good news if you own something like Tesla. It also often means that the uptrend is not over. Usually when you’re extremely overbought, you often will get a brief pullback, but you’ll accelerate and actually push at least one more High. A lot of times that creates that bearish Divergence. Fibonacci analysis tells us 220 was a key level, which we now broke through. 300 to 310 is the next upside level and that is not too far above current levels. That is where, we might anticipate further resistance on this outperforming name.
Finally, we’ve much talked about Gold and the struggles in the Material space and the Commodity Space, with precious metals in particular. Here we look at the chart of Silver and find the peak around 24, the bounce off of 21 on the SLV and that’s a Fibonacci level from the September low and the April and May High. We bounced off of 21, we then hit the 50-day moving average and we are now rotating lower yet again. We broke that 21 level and the next expected level for us is the 200-day moving average, which is around 20.50. Fibonacci analysis, however tells us that we could be going even further down to around 19.44.
Just like the S&P, we think that, if charts like Silver and Gold put up a trend line off of the lows, it may presently give us a really interesting support level to pay attention to, that could be around 20 or 19. Depending on how quickly we sell off, that might be the ultimate support level for the Silver space.
The other thing that we would note on the chart of SLV, is the fact that the momentum has not been particularly strong. We had this bearish momentum Divergence, from April into May. The price really didn’t make a higher high and was more stable but, If we look at how the the Divergence played out with the momentum actually sloping down or over downwards over that period, That tells us that the uptrend is likely exhausted. That is what we are also seeing now with charts like AMD and others with that bearish Divergence. Now that we’ve rotated lower, we can see that the momentum is remaining below 60 on a rally phase. That is way classic configuration for a bearish trend. We think the weight of the evidence is still bearish until proven otherwise.