
Image by Jonn Doe from flickr.com
Tuesday Market Recap – Dow Jones and Other Major Indices
Focusing on what sort of key movements and key reflection points we can capture at the end of Tuesdays close, this seems to be another move to the upside or potentially a bounce off of support for the S&P and Dow Jones. We’ll see what sort of conclusions we can draw from this.
Dow Jones and Major Index
While looking at the Major averages on Tue, it was a nice day that was in green for all of the indexes except for the VIX.
The S&P 500 was up 1.2 percent and that’s just below 4380. The NASDAQ Composite was up about 1.7 percent, the Dow Jones was up 0.6 percent. Therefore, NASDAQ or the growth areas of the market lead the way higher and the top three sectors on Tue now, were once the bottom three sectors on Mon, where they had given back away much on Mon but, on Tue they sort of regained some of those losses from the previous day.
Mid Caps and Small Caps were up as well and it’s worth noting that even though the NASDAQ was up 1.7 percent, the Small Cap S&P 600 was up just a little bit more and the S&P 600 was just below 1200 however, it was a nice update with almost two percent being up. Therefore, we’ve seen some renewed strength in Small Caps, which usually is a really good sign of a risk on. It’s not been a particularly accurate way of measuring risk over the last couple of years because, the Small Cap Index has been underperforming during bullish phases due to the dominance of the Mega Cap growth trade,is what we would argue more than anything.
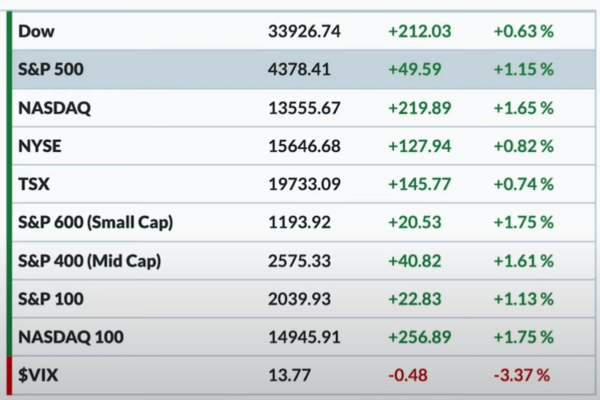
VIX
The VIX is back below 14 and that has been a level we’ve talked about many times. Getting down to a 13 handle is a very low level of volatility and that’s even undercutting the level of the VIX which we had seen way back in 2021.
Bonds
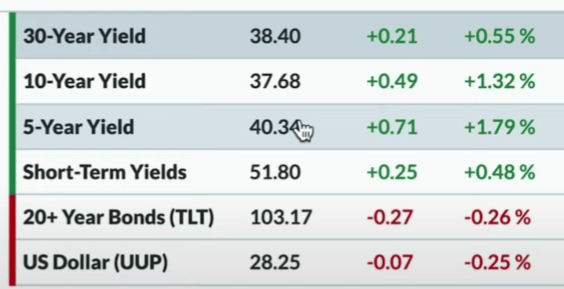
As we continue looking at other asset classes, we had the yield curve higher across the board. The short end was up a little bit to 5.2 percent, the long end was around 384 and again all across the yield curve board, we were moving higher. The 5-Year point was back above 4 percent, Tenure yield was around 377. Therefore we saw all the yields rotate higher.
It’s really the economic data that we saw earlier on Tue like the Home Sales and all of those pretty encouraging numbers that apparently indicate that the FED has room to continue to take action and the economy is doing just fine and right now maybe the recessionary Playbook has pushed itself down the road a little bit further.The Dollar Index was not too much different from Mon, it was down about 0.25 percent using the UUP.
Commodity and Cryptocurrency
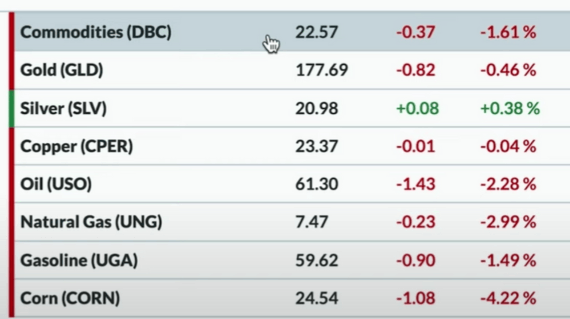
Looking at Commodities, we had the DBC down 1.6 percent and that’s Energy prices that struggled on Tue and dragged that broad Commodity ETF down, The Commodity ETF, that is really weighted more towards the Energy space.
Precious Metals were a little less negative and Silver prices were actually very narrowly in a positive with 0.40 percent up. Gold was down by about 0.50 percent. We still think that the charts of Gold and Silver are on the struggle bus in a lot of ways breaking down and there’s a clear Trend Channel that’s now broken and what that tells us is to rethink the structure when we have a trend in place, or when we have a trend line that is kind of consistently tracking the movement and then it breaks, telling us that something’s different and we can call it a change of character. We would argue, that’s exactly what has happened in the charts of Gold and Silver both.
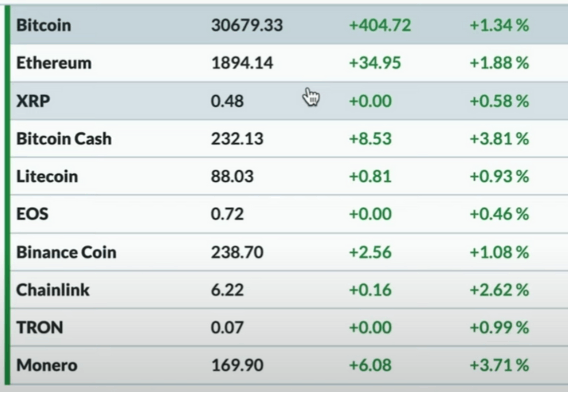
Finally Cryptocurrencies were all back in the green. it’s been a choppy week or two, if not more. With Cryptocurrencies, obviously there is a lot of news flow around this space, a lot of regulatory pressures, new ETFs being filed and all of that causing a lot of movement to the upside and the downside. Cryptos neted out to a positive day on Tue, with Bitcoin up about 1.3 percent, Ether just below 1900 and that’s up about 1.9 percent from Mondays close.
Sector Performance
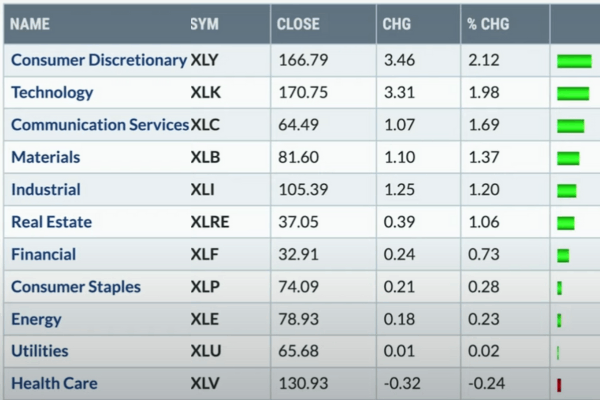
In terms of sector, as we had mentioned in our intro, growth sectors are at the top of the list. XLY, XLK, XLC were up 2.1 to 1.7 percent and hence we see a nice strong re-energizing of the uptrend from some of these leading sectors in 2023. These have been the top performing sectors year-to-date but, they had been sort of cooled off here recently as charts like Alphabet and AMD and others have pulled back whilst others have remained quite strong and a day like Tue sort of renewed that move to the upside. A lot of charts in a lot of different sectors that we could talk about like Airlines, some Health Care names and others that sort rotated to the upside on Tue, in a big way.
At the bottom of the list, Healthcare was the worst performer on Tue and was the only one amongst all the S&P sectors that we track, that was actually down by about 0.25 percent. Utilities ended up flat for the day and then Energy was third from the bottom. Some of the defensive sectors particularly Staples and utilities, on Tue underperforming the major benchmarks and certainly dramatically underperforming the leading sectors or the growth sectors, here in 2023.
Trend and Stock Watch Over Dow Jones S&P and Other Markets
No.1, as we look at growth versus value, we will talk about some of the market top checklist items and ask ourselves, What would suggest to us that a market is topping out?. We think that in 2023 it’s been all about growth leadership and particularly the Mega Cap growth leadership and therefore, if and when we see a rotation away from some of those top performing names then, that is a dramatic change of character which is what we are always trying to anticipate and then identify when it happens.
We plotted a chart that looks at the S&P 500 in the top part, the middle portion looks at Growth versus Value and that’s using the two ETFs the IWF and the IWD, the bottom portion of the chart looks up what’s called the Pure Growth and Pure Value. What usually happens is that, in Growth and Value indexes, a lot of times there’s some growthy stocks and some value stocks and the names actually overlap a little bit because, there are some names in the middle that are considered both growth and value as they demonstrate characteristics in both Pockets.
However, Pure Growth and Pure Value just focus on the barbells or the names that are just purely growth on the growth side or purely on the value side and as a result sometimes could be a better indication of that rotation. It’s worth noting from this Chart that we plotted, the S&P continued to go higher, the growth versus value ratio continued to go higher, the Pure Growth over Pure Values started to turn a little bit. We think this chart might be important to understand if and when we can get a continued rotation to the downside.
No.2, as we mentioned in our intro, AMD and Alphabet, the 2 key leadership names pulled back recently. When we look at both of them, they’ve pulled back to an ascending 50-day moving average. In bullish phases, we will often have leading stocks make a new high and pull back to an ascending 50-day or 10- week moving average and then rotate right back. This ends up being that fat pitch chart, that is Strong Trend, Short-Term pullback, and then an opportunity to rotate to the next high. AMD has pulled back to the 50-day moving average and the RSI is sitting just above 40.
This is a kind of that sweet spot, where if it’s going to work then, this is kind of the time where we would expect it to be however, if it fails to hold the 50-day moving average then, that’s when we have to think about, maybe some further downside and a change of our perspective on a name like AMD, that has been working.
Finally, whilst talking about the defensive sectors, we talk about things like Energy, and Materials which have been underperforming.. When we ever think of sectors that have done poorly and hope that they would now probably display a rotation with a very different look, that would be the defensive sectors like Consumer Staples, and Utilities that could be starting to do well.
The relative strength ratio of Consumer Staples to SPY and the relative strength ratio of Utilities to SPY, both reveal a lower ratio. This means that these defensive sectors are underperforming and that has been the story in 2023 for both of these. These sectors will start to rotate higher, only when these ratios start to turn higher and whenever that happens on this ratio comparison chart, that is when we would argue that we need to start thinking way more defensively and focus risk off because that will tell us that investors are rotating to the relative safety of two very defensive sectors.
Credits
photo credit by
The image insets used in the Featured Image for this post is obtained with prior public/paid subscription or permission and therefore is credited to the following entity or entities, The final Featured Image in this Post is however the Artwork of USA TRENDING HOUR (UTH). All rights are reserved to this artwork or final Featured Image of this Post and any reproduction or use of the final Featured Image without prior written permission and consent will be dealt with strict penal action as per international laws.
Featured Image :
Image by Jonn Doe from flickr.com
Featured Image Inset Elements by :
Other Content Image Element(s) by :
Element Name : photo credit