
Image by Jonn Doe on flickr.com
Thursday Market Recap – Dow Jones and Other Major Indices
On a day like Thursday, some cyclical sectors, some value-oriented sectors, like Financials, Materials and Energy could be seen moving to the top of the list. On Thu, the Major averages were sort of mixed, the Dow Jones had a good high up, NASDAQ was flat, the S&P was up a little bit but, overall some of the the beaten down sectors and some of the underperforming sectors like Financials and Materials had a pretty decent day. It’s the beginning of a raging recovery for Financials but, we don’t know if we could say that just yet, however we are seeing some signs of life in charts like JP Morgan that maybe starting to break out.
Dow Jones and Major Indices
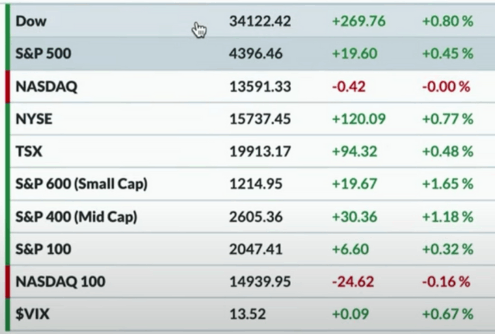
As we get to the Market Recap and see what’s actually played out through the course of the trading day. On Thu Again, our Market Trend models that we highlighted in yesterday report remains bullish on all three time frames and that will definitely change at some point but, it’s not changed on Thu certainly. The Dow Jones outperformed the S&P on Thu, the NASDAQ underperformed actually and ended up flat for the day. For the NASDAQ 100, whilst focusing on those Mega cap growth stocks, was down by just a slight amount, about 0.2 percent. Mid Caps and especially Small Caps had a very strong day on Thu. The S&P 600 Small Cap Index was up 1.7 percent.
VIX
Volatility pushed back up, but not by much. The VIX is still relatively low compared to the last 12 to 18 months and it is amazingly. Even when compared to 2021, we’re at a lower level of the VIX than we were for most of that year. So VIX in the low teens as the Market’s going higher, means in our analysis, that we are in a slow and steady uptrend and kind of that grinding higher environment.
At some point that will change and at some point the uptrend has to break because, charts that have been going up, stop going up, they stop making new highs, they start making new lows. That broadly speaking, is not happening a Ton in reality, particularly in the leadership stocks that we would want to identify.
As volatility would start to increase, that would be a likely change from this low volatility rally that we’ve seen. For now, it’s telling us more of the same Market that continues to be in a fairly healthy stage on low volatility.
Bonds
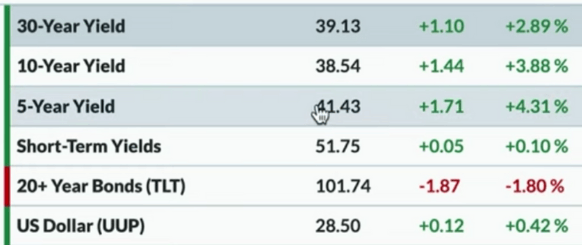
Interest rates overall moved higher. The short end of the curve was not much of a change, the middle and the longer end of the curve really pushed to the upside a little bit. 10-year yields finished the day around 385. the 5-year yields were well above 4 percent as now we’re on 414.. Therefore you see, we are looking for those rates going higher. We found a bit of a change herre with the TLT, which is the bond price ETF and which is a long treasury ETF was down almost 2 percent. This is still very range bound, but it is sort of rotating to the lower end of the range that it’s been in for quite some time. Continuing further, the Dollar was up a bit, about 0.4 percent for the UUP.
Commodity
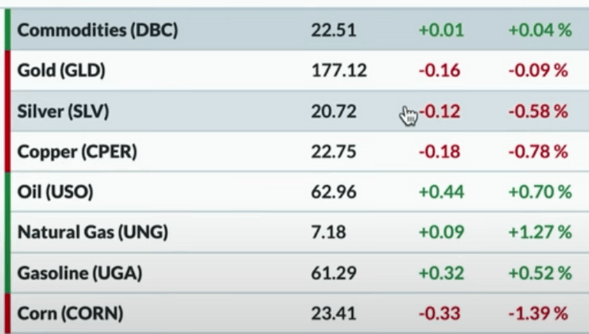
In terms of Commodities, it wasn’t a ton of change. Broadly speaking, the DBC was flat for the day. Gold was just a little bit below zero, but not with much of a change.
Silver prices continued to struggle and we’ve seen Silver underperforming Gold. Here recently, both of those charts we would argue had kind of broken in terms of a strong uptrend.
Gold and Gold stocks had been one of the stronger areas of the market, not too long ago but, now Gold is very much changing and rotating lower. With this shift, if we are wondering about what type of a rotation or what type of a change of character this could look like? then, we may look at the chart of the GDX or something like that and this will reveal, a position of strength rotating to a higher position of relative weakness.
Oil prices moved up a bit on Thu and Energy as we mentioned had a decent update along with some of the other value-oriented sectors.
Cryptocurrency
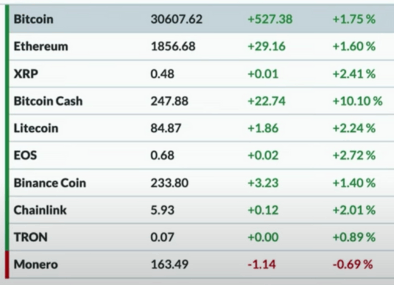
Cryptocurrencies continued to push in the green and we see Bitcoin was just above 30600, Ether was just above 1850 and both of these were up about 1.6 to 1.8 percent.
Sector Performance
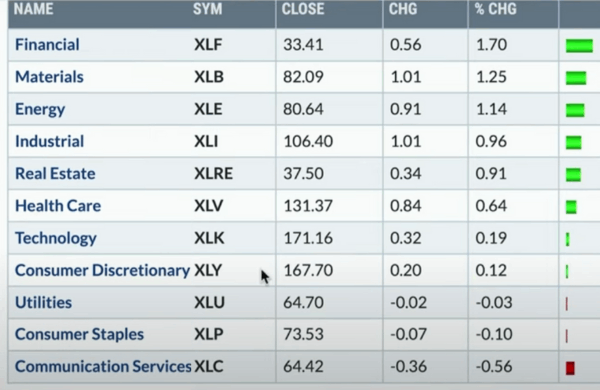
Finally when we look at the S&P sector list that we usually track, the leadership that we’ve been often talking about, were all at the bottom of the list or we could say many of them were at the bottom of the list. On Thu, the XLC was the worst performing sector that was down 0.60 percent. There were a couple of other sectors that actually had a really decent update, like the Financial Sector, Materials and Energy. Financials were up 1.7 percent.
One of the sector that we’ve not talked a ton about, but which is now particularly at the top of the leaderboard is the Financial sector. The average chart in the Financial sector is not particularly strong, especially on a relative basis when we compare it to the strength and the resilient uptrends that we’ve seen in some of the growth sectors. The Financials, Materials and Energy sector are very much underperforming, but on a day like Thu, they all had a bit of a mean reversion and these beaten down sectors started to a rally.
Our rotation into these sectors will of course have days like this Thu but, then there has to be more and more of them. We need to start seeing more and more of this, where there’s a a give back from some of the previous leadership and a rotation into some new leadership. We feel that, it’s a little too early to say, that move on Thu was a broader move, however it’s certainly a contrarian move from some of the trends that we’ve been observing through the course of 2023.
Trend and Stock Watch Over Dow Jones S&P and Other Markets
On the basis of the S&P, let’s try and understand the overall trends for the last three years. When we think about the move and the experience that we’ve had from the low in March of 2020, to the high at the end of 2021, then the low in the fourth quarter of 2022, upto where we’re at now, there are just clear Trends to the upside and the downside.
It’s a pretty significant drawdown of around 27 to 28 percent or so depending on how you measure it from the Peak at the beginning of 2022 to the October low, but from there we’ve now retraced over 61.8 percent. What’s interesting is that, when we look at the chart on this time frame and think about the bigger picture to see how meaningful it might have been when we get above 4300, this pullback that we’ve seen recently to sort of that 4310, 4325 level, that can be really meaningful.
As long as that holds again the framework that we see here tells us that we’ve rotated above and now we’re in an uptrend until proven otherwise. We break that level and then we feel we have to put a question mark on and start to think about a different state but, as trend followers, we will continue following the trend. The trend for now is higher highs higher lows, still going to the upside.
No.2, the TLT, We are looking at the long Bond ETF, essentially the bond prices. We are looking at the last couple of years to see how bond prices of course have been going lower through this course here, and then we can see that in 2023 it’s been basic, it’s been a sideways pattern. On Thu, the TLT was down about 1.8 percent and it had one of the worst days that we’ve seen in quite some time but, that drop is still just on the midpoint of this range that we’ve been in. What’s interesting is that, this is a market that has been consolidating. When we look at the RSI, it has rarely got much above 60 and it’s rarely got much above 30. On Thu, with that drop, it’s just flipped below the 50 level, but we’re still sort of in that neutral range.
No.3, is UAL or United Airlines Limited. We think that Airline space within Industrials has been actually an emerging area of strength and starting to do pretty good as some of the other names like Alaska and AAL and others had a bit of a bounce here but we see and take note of a bearish pattern on UAL.