Image by sergeitokmakov from Pixabay
Friday Market Recap – Dow Jones and Other Major Indices
We will indeed wrap the week and we’ll look at this short holiday week of Tuesday through Friday to understand what changed in Dow Jones and other Major Indices and what we learnt from the markets. Breadth conditions continued to deteriorate. We can now see that, those leadership names have started to take a bit of a pause in the broader Market, thus taking a big breather.
We had a good week. We’re going to talk about this sort of continued short-term rollover. A lot of our focus has been on what we call, a rotation of sorts, a potential pullback phase, the type of markers that we can track, and what sort of indications that we can identify and help us anticipate that rollover.
We’ve seen breadth indicators that were exceptionally strong, the NASDAQ 100 bullish percent index, over 70 percent of it is now back below, the McClellan Oscillator that had been above zero is now back below zero as of Thursday’s close. Therefore, a lot of the overheated signs have now become alleviated and this mentally indicates a sort of being a pullback mode as we prepare to go into the next week. What does that mean ?, and What key levels should we identify on the way potentially lower?, is something that we’re going to talk about in this report.
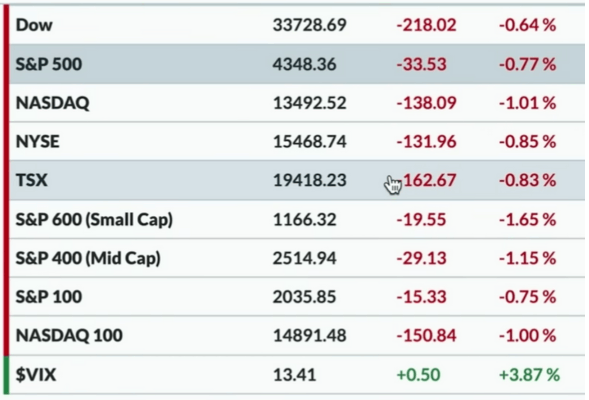
On Fri. all said and done, it was a lot of red on the screens. It was overall a sort of a move that was away from offensive, into more defensive posturing. Although in terms of sector movements it wasn’t as dramatic as one might expect but, certainly in terms of the price retracement we have seen everything come off a little bit. The Dow Jones continued its pullback on Fri, and was down 0.64 percent. The S&P 500 finished just below 4350, that’s down about 0.8 percent from Thursdays close.
Therefore, S&P is still above 4300, still above the August 2022 highs, and still above the most recent breakout level. Based on any sort of general definition that we could come up with, we can say that the S&P is overall still in an uptrend but, it is certainly trading lower within the context of that sort of medium term uptrend that has been identified till now.
The NASDAQ Composite pushed below 13500 on Fri, down about 1 percent from Thursdays close. We therefore had everything going down 3 to five percent in a one day, kind of session but, nothing was going up. However, this is not the end of the World. We feel that, in a bull market year, when things are not going up, it is a red flag and we would wonder what this means and what’s next to come? but, overall let’s be patient and focus on the longer term Trend. We’re certainly in a pullback phase we would say.
At this point Mid Caps and Small Caps are feeling the pain, especially the Small Caps S&P 600 that was down 1.7 percent. Small Caps lacking participation is still underwhelming to be honest. By any measures, we’re really not seeing the follow-through by Small caps, here in this June of 2023, and that might be the most important area to watch. Therefore, higher beta Small Caps were still rolling over, yet again on Fri.
VIX
On Fri, the VIX moved higher. Of course, VIX is still very very low relative to the last 12 to 18 months. This low volatility environment is really more characteristic of bull market phases. It is much alike the 2021 Playbook with a nice slow and steady uptrend on Lower volatility. That is what 2023 is much alike now, even if the drivers of the 2023 environment is very Different. In general, from a technical perspective, we find a lot of similarities between those two periods.
Bonds
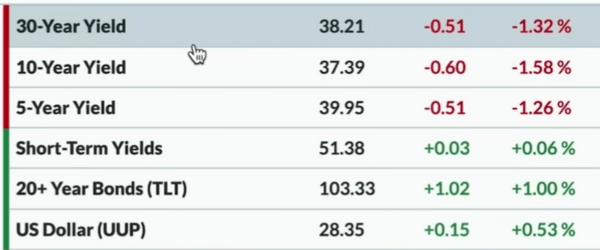
Let’s look at some other asset classes here very briefly. Looking at the fixed income markets we could see that, for the most part, the yield curve had come off. Through the course of the week, we had the yield curve moving higher however, on Fri, it overall came back a little bit, as the bond markets rallied. Therefore, we see a classic sort of defensive moves where stocks came down and a rotation was seen into fixed income or gold. It was this type of classic Safe Haven plays that we saw on Fri, going into the weekend.
The TLT was up about 1 percent, 10-year yield was down to 374. 5-year yield dipped just below 4 percent.
The Dollar Index was up about 0.50 percent and that’s another thing to look for. The challenging environments of 2022 was marked by a strong Dollar and a everything else being pretty much weak. We call the Dollar, the wrecking ball for risk assets.
All the risk assets like stocks, cryptos and others including Bonds are in a downtrend and the Dollar just ripping to the upside therefore, we have something to watch and wait to see if we get some consistent moves higher in something like the Dollar Index or the Dollar ETF.
Commodity and Crypto
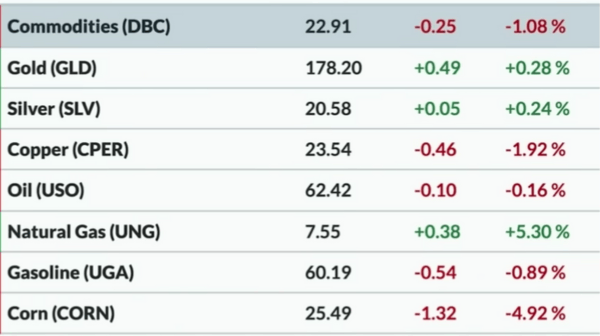
Looking at Commodity markets, the DBC was down about 1.1 percent. It was not a bad day but, certainly not a good one either. Copper prices were down the most, about 2 percent.
Although Corn and the soft Commodity space was down about 5 percent on Fri, using the CORN ETF. Crude oil prices did not have too much of a change from Thursdays close and was down a bit.
Gold and Silver were both up, about a 0.25 of a percent therefore, this is another thing to watch. We had reported in the last couple of days about Gold and Silver really breaking down below a trend channel that happened in play since last November and short-term weakness is kind of taking us below that lower Trend channel line. We are seeing the opposite of that now. We’re now seeing a nice rally in with Gold and Silver. This might be something to watch for in the next week, particularly if you get more of a risk off move and more of a pullback in stocks. That’s where we can see Gold and Silver prices starting to rally.
Cryptocurrency
A lot of green could be seen on the page of Cryptocurrencies. Again, there’s heavy news flow right now of regulatory pressures, of institutions coming big into crypto and taking dramatic steps, of ETFs being filed and all sorts of fun news flow to try and capture the most out of crypto.
At the end of the day, the charts of Crypto tell us about a rotation that had once been bearish on Bitcoin and Ether, but now there is too much more of a bullish rotation. We’re seeing nice moves higher, seeing brief pullbacks but, overall we would say when Bitcoin pushed above 30000 and now again it is sort of testing the highs from earlier in 2023, and finds itself in a position of strength.
The real question is, Can we get above 31000 and push above resistance?, Can we make a new high for this cycle for Bitcoin?, Can Ether get above 2000, which is sort of that big round number that is not too far above current levels?.
Sector Performance
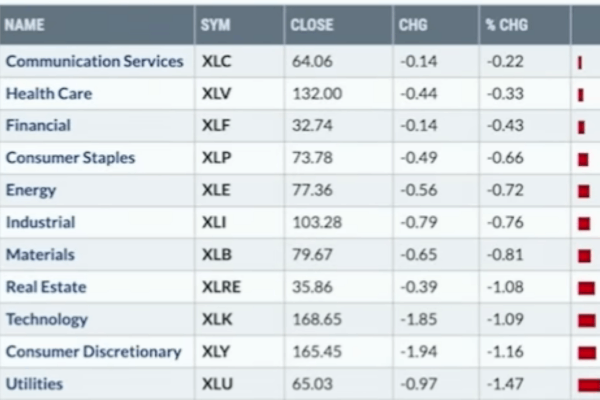
In the sector returns, all S&P sectors that we usually track, were in the red on Fri. Communication Services, the top one of the 11 was down about 0.20 percent and therefore, it was not too much of a down move. Health Care was no.2 and that’s an interesting one because we’ve highlighted some of the Health Care stocks that have actually emerged and been fairly strong here recently so keep an eye on that one. Financials as well was down 0.40 percent. The worst performing sectors were Utilities that was down 1.5 percent, Consumer Discretionary or XLY was down 1.2 percent, Technology was down 1.1 percent.
Weekly Update – Dow Jones Other Major Indices Bonds Commodity
In the Weekly Market Recap We looked at the charts of the major asset classes that use ETFs for the most part and tried to understand where we were last Friday and where we are today. The S&P 500, now finished the week with drop down of 1.4 percent. This is not so horrible but, if you look at the weeks that have gone by in 2023 then, certainly this is one of the worst weeks in a pretty consistently strong Market environment. Therefore, for now we know that definitely, the market this week is in a pullback phase. The NASDAQ 100 the QQQ not too much different and was again down 1.3 percent.
The Gold ETF GLD was down 1.9 percent, Small Caps the IWM was down 2.9 percent. Very close to that was Crude Oil prices that was down 3 percent. The worst performer down here was Emerging Markets, that was own 4.2 percent. Two things were up for the week, the dollar and bonds that were both about the same 0.70 percent. Therefore, those two ETFs, namely the UUP which is a dollar ETF and the TLT which is a long treasury bond ETF, were both up 0.70 percent.
Bitcoin had a Monster Week and was up 17.3 Percent. This was like being back into the Golden Age of Bitcoin and it’s a Raging Bull Market you know where we’re talking about 70000 as the next step, that is up to a few hundred thousands, if not a million in the next couple of months. Bitcoin had a positive week of about 17.3 percent.
Trend and Stock Watch Over Dow Jones S&P and Other Markets
No.1, For right now the reality is, as of Thursdays close that echoed with Fridays weaker moves, the McClellan oscillator is back below zero. Late April to late May was the last time when the McClellan oscillator had been below zero and that was the first time in the last 18 months, when the market hasn’t pulled back more when the McClellan oscillator is below zero. Therefore, we think of this as a pretty consistently helpful sell signal and that’s another reason why we should think of being defensive and just expect downside to continue, thereby protecting ourselves from downside movements. We think that it’s an opportune time to have that thought process, if you’ve not done it already.
No.2, when we looked at the performance tables and tried to analyse the month-to-date Returns and how the month of June has actually been then, we find that the S&P in the month of June so far has been up about 4.1 percent.
The other sectors like Healthcare, like Technology, like Communications Services are all up 2.9 to 3.7 percent. This makes us wonder, why the S&P is up 4.1 percent when all these other big sectors are down. It’s because, here the XLY is up 9.4 percent just in the month of June. Of course, this is a cap weighted ETF and therefore Amazon, Tesla, Home Depot make up over 50 percent of the XLY. Amazon and Tesla that had a pretty strong week, is going to power the XLY up and again a lot of these gains have come from the earlier couple of weeks ago, where we had a big acceleration with a lot of those names and therefore, the XLY is really a top performer, even though it may not be the top performer in the month of June.
Finally CE which is a Commodity Chemical named Celanese reminds us of the question, What does one think is the toughest environment, whether its a bull phase or a bear phase or a sideways phase, and whether or not we should tend to be more bullish or tend to be more bearish?. We would say sideways markets are the most frustrating because, we just do not have a directional move. It’s not like, as if it’s moving against us and that we are getting a clear signal to cover shorts and go long, it’s not like the Market’s tanking and we hit stops and we just sell.
A sideways consolidating Market is like everyone’s just sitting on their hands waiting to see what happens and it’s kind of boring and it happens way more often than we probably would guess that it does. This chart of CE has a clear pattern known as a coil pattern or a symmetrical triangle pattern lower highs, higher lows, its sort of coalescing around 110 dollars a share, which is where we’re at right now. The RSI is net neutral. In some ways, these charts are frustrating but, they’re also very easy because, all we’re waiting for is a break out of that coil. Now, Do we break above the upper bound or below the lower bound that could be the momentum signal we are waiting for.