
Image by Mithuns moneymarket from Flickr.com
Friday Market Recap – Dow Jones and Other Major Indices
As we wrap the week every Friday and as we look back at the week that just occurred, we learn that certain things did change and were different, particularly the Improvement in breadth but, overall we noticed a lot of similar Themes. Friday was sort of a choppy session and there was not much of a change. Dow Jones was almost Flat and ended on the upside. By the time things were said and done, the S&P pushed above 4300 and then closed back below it.
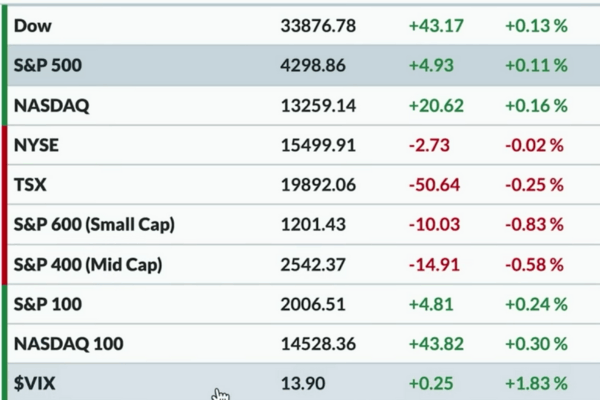
Over the last week or two, we have reached 4300, we have given a lot of opportunities to push above there, but we have not quite done it. We finished the week below 4300 yet again, therefore we must once again reinforce the importance and significance of this Resistance level.
The NASDAQ Composite was about the same, and up about 0.2 percent. Mid Caps and Small Caps both pulled back on Fri, with the S&P 600 Small Cap Index down about 0.8 percent. The VIX actually popped higher a little bit, but not by Much. The VIX was still below 14 and still very low, relative to what we have experienced over the last year and a half.
Bonds
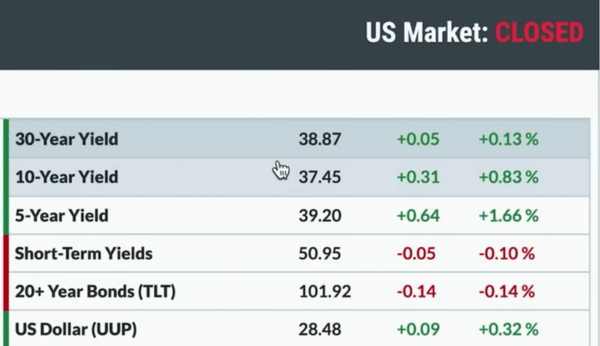
As we quickly look at some other Asset Classes, Interest rates for the most part moved higher. 5, 10 and 30-year points all pushed higher. 10-year yield finished the week around 375, 5-Year Point actually got closer and closer to 4 percent and the long bond yield was just below 3.9 percent. Dollar Index was about 0.30 percent higher from Thursdays close and there was not too much of a change.
Commodity
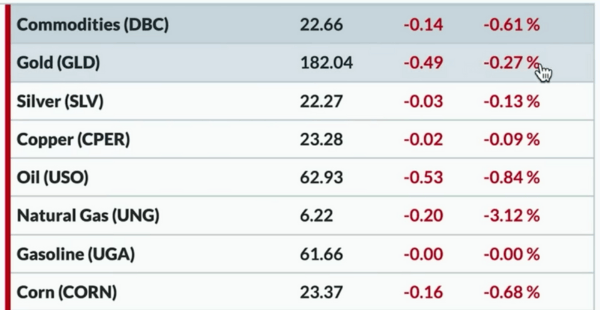
All the Commodities were in the red but, not too bad though. They were all in the red but, it was not a horrible day. Gold and Silver both were down a bit, Copper prices remained almost unchanged from Thursdays close but, closed slightly in the red.
It was same for Cryptocurrencies. Bitcoin actually had a pretty choppy trade. Bitcoin was currently around 26430 and that’s down about 0.30 percent from Thursday. Ether prices were just above 1830 and the rest of the mix of cryptos were in net negative and did not overall have a lot of movement.
Sector Performance
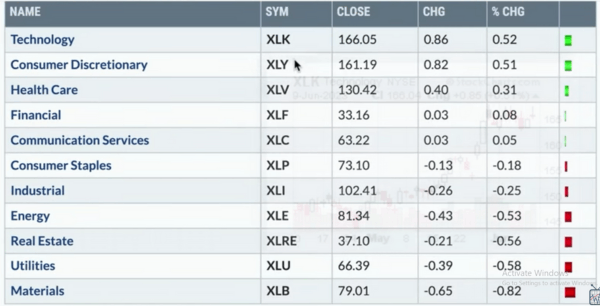
Iin terms of sector movements, on Friday, Technology and Consumer Discretionary, XLK and XLY were at the top of the list. Both were up about 0.50 percent, followed by Healthcare. Everything else was flat to down and at the bottom of the list we had Materials that was down 0.80 percent. Utilities and Real Estate were down about 0.60 percent each.
Weekly Update – Dow Jones Other Major Indices Bonds Commodity
When we look at the last five trading days and just see how markets have evolved from last Friday’s close on June 2nd upto this Friday’s close here on June 9th.
The S&P 500 really chopped around through most of the week that ended on 9th June. We again, feel like, the overall trajectory has been this current rally, up to 4300 and that now We have sort of stalled out and we may call this, a power on stall or a sort of holding that is steady right about this level of 4300 and it is no longer going higher neither really coming down. We are sort of still waiting and watching, we are treading water to see if there is enough upside momentum to push us through resistance instead of just ending up at resistance.
At the end of the week with Fridays and Thursdays rally, the S&P finished up about 0.50 percent. Gold was up and was just slightly high around 0.6 percent for the weekend. Emerging Markets were up about 1.6 percent, Small Caps were up 1.9 percent and everything else had actually underperformed the S&P and were down and flat for the Week.
Bond prices basically were down about 0.10 percent, so essentially it was a wash. The NASDAQ 100 as well was flat for this week. As of Wednesday it was pretty low move for the week and then It bounced higher over the last couple of days. In the green, we had the Dollar or the UUP, which was down 0.30 percent. Crude Oil using the USO was down almost 2 Percent. Bitcoin finished the week down 3 percent but, again it was a pretty choppy Week, ending up with not too much of a change from last Friday’s Close.
Market Trend – Dow Jones Other Major Indices and Sectors
If we were to analyse the Market Trend model, long-term and medium-term and short-term all seem to remain bullish. This had been the story from February into March. March, is when they all sort of completed the rotation bullish. We see that, at the end of March, it was the long-term model that finally turned bullish. Now, in all three time frames, we may say that that it’s bullish.
Let’s be clear that the trend in the Major Averages, remains strong, even though we’ve stalled out a little bit. Now, while the S&P is breaking above 4200 and testing the August Highs at 4300, let’s remember that the advanced decline line is still well below its February high, it’s still below the April Peak. Therefore, while the S&P has gone from the April Peak to where we are currently now, the events decline date is actually weaker over that time.
Over 50 percent of the S&P members are above their 50-day moving average and that’s encouraging as long as it remains above 50 percent on any pullback. That tells us, the conditions are pretty Strong, as about 56 percent of the S&P stocks are in a bullish point. From the S&P charts, as we check the Relative performance of the equal weighted Consumer Discretionary versus equal weighted Consumer Staples, to know whether investors are rotating more into things Consumers aspire for, or more into things consumers need the most. The story is more offense over defense
Stock Watch
In our Stock Watch ssection, We highlight the fact that, Netflix is gapping higher yet again. On Fri, Netflix was up 2.6 percent, which is a nice upward Gap to finish the week after having traded lower through the course of the day. However, It was overall a nice week for Netflix that finished at 420. Now, this is after Netflix had rallied up to 400 375 was the resistance level for Netflix in February and also in May.
We pulled back from that level and then broke above there a couple of weeks ago. From there we have sort of dribbled higher as we see Netflix has been overbought right now. This simply tells us that the trend has been very very strong. W wait to see, when we can come out of that overbought range. A lot of times that can tell you about a little bit of a pullback likely occurring, but overall the trend is strong, momentum is strong and relative strength is strong.
The largest gainer in the S&P on Fri, was MATCH group or MTCH. What’s interesting is, looking at MATCH GROUP, we learn that, it’s always important to not just consider one day’s returns. We could see MATCH GROUP is up six and a half percent and we feel that’s huge. How did we ever miss that big gain, we wonder. If we look at what the last two years have been like, for the MATCH GROUP, we see that, MATCH has certainly broken above the 50 day moving average and that’s always usually a good sign when that happens.
The last time we had this kind of move was in December of last year. January of this year, we stalled out a couple of points, of perhaps maybe 10 points we stalled above the 50 day moving average and then we rolled back over. Therefore, now we have to see, how far we are getting away from there. We will notice that we broke up above the 50 day moving average and we were overbought in January. We never made it to the 200-day, we rolled over, and when we became overbought and then rolled out of that overbought region, that was the indication that this was maybe a sellable Peak.
We wait to see what happens Now, since we’re testing a big resistance level in the form of the 200-day moving average. MATCH was last above its 200-day, back in November of 2021, so we’ve been in an established downtrend for quite some time. We feel that, for a lot of investors, the question is, when does this MATCH stock prove itself as more of a bullish rotation?. if you are more of a short-term swing Trader type then, maybe this has been enough where one has seen enough of a break above previous resistance. We would now love to see a break above the 200-day, We would love to see a higher low on a pullback, which is one thing we have certainly not seen, yet.
Today, as we take the January 2022 High and the October 2022 low, we see that 4000 represents a 38.2 percent retracement. That was a big major high in the fourth quarter of last year. We are now at the 61.8 percent level at 4310, which lines up beautifully with the August 2022 high. This suggests two things, number one the level we’re at is pretty important. Also we should note the 50 percent Retracement which the February highlights up pretty well around 4150. Once we get above 4325 we will have eclipsed that last level and the Fibonacci analysis tells us we are probably going to go on to all-time highs.
Looking at the Energy sector, we think a lot about mean reversion right now, Is Mega Cap growth trade over?…. Are these names like Meta and others that have had a run and that have really moved the market higher in 2023, will cause more upside to that trade?… Are things like Energy and Financials, which have been Underperforming until now, beginning to show any signs of life. We think June so far has been a pretty good month for the Energy sector. We have seen this bounce from a low.
At the end of May, we have actually rotated higher but, we would need to see a little bit more and that’s what we are drawn to looking at this Energy chart today, As we wait to see Energy get above the 50 and the 200-day moving average, as well as the momentum to get more bullish and also the relative strength beginning to turn higher. These are all the things that may be starting to happen in June but, we would want to see through the end of the month, if we continue to go higher. We think the Energy sector might be a really important one to watch as a potential area of leadership.