Image by Mohamed Hassan and Peggy und Marco Lachmann-Anke from Pixabay
Wednesday Market Recap – Dow Jones and Other Major Indices
Here in mid of June 2023, we’ve been tracking this rotation away from some of the biggest leadership names in 2023. Today we’ll look at some of those leadership names and how they’ve been doing so far and what signs of rotation we may be seeing on some of them. A name like Alphabet potentially rotating lower and charts like Tesla had a bearish candle pattern on Wednesday,? Let us understand, what that tells us about short-term Dynamics versus the longer term Trends?.
After Tuesdays close, coming into Wed Market hours, we continue to track the rotation in the markets. On Wed this rotation was carried forward with the NASDAQ being down 1.2 percent, the S&P 500 being down 0.50 percent, and the Dow Jones down about a 0.30 percent.
For a little while it was Dow Jones that was up and NASDAQ down and the S&P slightly down. Everything else was kind of rotating lower through the course of the afternoon, finally finishing more near the lows of the day. This drop has pushed the NASDAQ Composite down to around 13500. The S&P 500 closed just above 4365 therefore, we are still above 4300, which is a important breakout level that we have talked about for quite some time in the immediate recent past. 4300 was the key Fibonacci level, that was a resistance level from the August 2022 High.
Breaking above that level is pretty significant and holding that on a pullback is potentially even more significant. Whenever we start to break above levels but, fail to hold them on a pullback then, we begin to question the sustainability of the uptrend. For now though, at worst it’s a pullback within an uptrend, until we start to see further evidence.
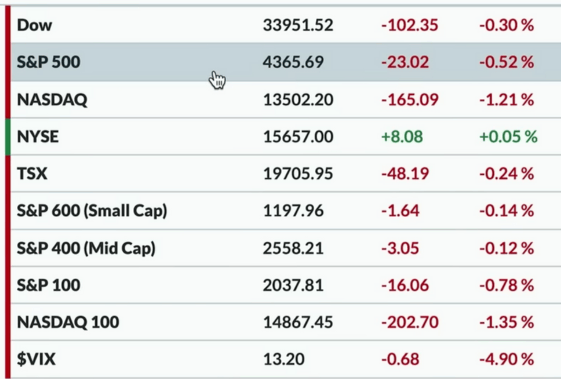
On Wed, the Mid Cap and Small Cap Indexes were both slightly down, but not too much and actually closed to an unchanged day. The S&P Small Cap 600 was just below 1200 points, the VIX is pushing lower and we’ve talked about that low volatility environment. We have to note that 2021 had a consistent slow and steady uptrend on Lower volatility, 2022 was more of a downtrend on higher volatility. The present volatility picture is a lot more like 2021 than 2022 therefore, should that cause us to be optimistic about the prospects going forward?.
Bonds
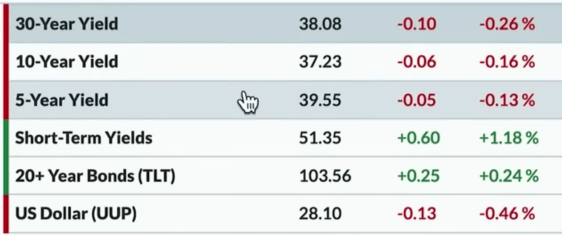
As we look at the Interest Rate environment, overall it wasn’t a ton of a change. The bulk of the curve was slightly down, but not by much, therefore 5-year yield was currently just around 396, 10-year yield around 372, the long bond yield was a little bit higher around 381. Short-term yields was of course still fairly elevated, relative to the rest of the curve and it has continued. that sort of inverted yield curve environment that we’ve talked about for quite some time in our earlier market reports. Bond Price using the TLT, which is a treasury bond ETF was up about 0.25 percent and the Dollar was down by about 0.50 percent. on Wed.
Commodity
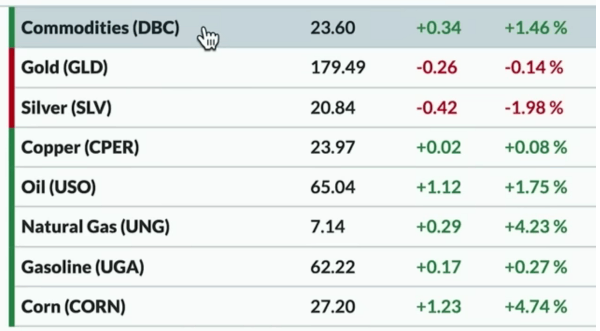
The Commodity space was overall mixed and we would say, in general everything barring the precious metals, did just fine today. The DBC is a broad commodity ETF that finished up on Wed, up about 1.50 percent.
Copper prices were sort of unchanged from yesterday. Crude Oil, Natural Gas both had a pretty strong update and Energy was one of the best performing sectors out of all the other sectors that we usually track everyday.
Things that were in the red on this particular sector list included gold and Silver. Gold was essentially flat and just slightly down from Tuesdays close but, silver was much lower and down about 2 percent. the SLV or the Silver ETF as well as Gold, they both have been in an overall uptrend, were testing the lower end of that uptrend channel and now breaking down and that’s what’s happened in the last couple of weeks where. We are starting to see a rotation. When we think about the potential for stocks and any sort of pullback
Cryptocurrency
We saw a lot of green on the chart of Cryptocurrencies. This is a news headline driven Market, where we recently saw all sorts of things in the headline. We had recently seen and heard news about regulatory pressures that dropped the cryptocurrency prices very quickly, then we had news about a major ETF provider talking about filing a new ETF and all of a sudden that news made things look really good for Cryptocurrency.
Bitcoin was up another 6.2 percent on Wed and that pushed it above the 30000 level. In the last couple of weeks, we had talked about Bitcoin and Ethereum pulling back to key Fibonacci levels where Ethereum for example had pulled back to a 200-day moving average. Both of them have now rotated higher and now those previous highs are once again in play.
Trend and Stock Watch Over Dow Jones S&P and Other Markets
Lets try to locate the new 52-week highs and new 52-week lows, as we feel this is an important theme to pay attention to, particularly when we’ve had a lot of the decent number of new highs. We notice here that, until June, there just wasn’t a lot of green and if ever there was a lot of green then, it was coupled with a lot of red aswell and a lot of stocks had made new lows. That is usually the sign of a market that’s struggling.
If we look at what happened from May into June, we find that, though we went from almost an even number of new highs and new lows to way more new 52 week highs, these were all because of the leadership stocks like Apple and Home builders and Building Materials and because of the other stocks that have had these great runs and that which just continued to pound away at a new 52 week high.
At the peak, over 10 percent of the S&P 500, made a new 52 week high on the same day. However, when we had our market Top checklist Revisited, one of the issues we looked for is an evaporation of green and a little more red.
Usually, when an uptrend is over, all of a sudden those names that had lead the way higher, sort of start to slow down and we usually get a rotation into more defensive areas of the markets like Consumer Staples or Utilities. These are however pretty far off, of their new highs and as a result these breadth numbers start to dry up a little bit. We are not seeing it necessarily yet, but that is certainly one of the trends we will be looking for, to see a change or a rotation away from new 52-week highs.
No. 2 we look at the Industrial sector, and scan stocks making new highs and lows.We focus a lot on the Industrial sector this week because that’s where we’re seeing a concentration of new swing highs like Building Materials and a lot of other names in the Industrial sector.
Names particularly of some Airlines have popped up there, along with many other Diversified Industrials like GE for example that tend to score pretty well. What’s interesting about the XLI is, when we really think about the longer term Trend, we’ve seen here that the industrial sector had a really good run in 2020 to 2021, it really hit a Peak in May of 2021 and dramatically underperformed the S&P in the second half of 2021. It was sort of a market performer in 2022, but then outperformed out of the October low. From there it’s been in a basing pattern, but just now rotating higher. 104 was a key level of resistance and that’s now been broken. We are testing it from above now. Can we get to a new all-time high, above 108 ?, that would be our main question for the Industrial sector.
When a sector is leading, it’s often up to those leadership names within that sector to really drive things higher. What’s encouraging now as we look at the Industrial sector in a little more detail underneath the hood is, that a lot of individual names are actually making new 52-week Highs and are very close to doing so.
We would like to highlight three top ranked stocks like BLDR which is Builders First Source, GE and CPRT which is Copart. If you look at all three of these, they display a nice consistent uptrends. What makes these charts strong is, we can base our arguments upon Charles Dow Theory 101 – higher highs and higher lows. When they pull back they keep making a higher low. This means one has a pretty clear idea of where each of these need to pull back to or need to pull back above to continue that Trend and as long as those Trend continues why would you fight the trend. Don’t fight the trend is the best advise.