Image by Jonn Doe from flickr.com
Monday Market Recap – Dow Jones and Other Major Indices
We’ll kick this week off by looking at how the markets have traded on this Monday. We had a shortened holiday week last week. Today we had the Dow Jones that was flat on the downside but, marginally however, S&P ended below in the red and NASDAQ ended up much down in the red, We had a continued retracement with some of the leadership names like Nvidia, AMD and some of those Mega Cap growth stocks that continued to pull back. Tesla, particularly had a weak day on Mon. Is this the continuation of a further drawdown for some of those previous leadership names is what we wonder, post Mondays’ market close.
As we get into our Market recap, as we mentioned in our intro, it was a sort of a weaker day for growth and that’s been a theme we’ve talked about here for a couple of weeks. Over the last week or two, we’ve certainly seen a big rotation and it was all about the narrow leadership, the Nvidia chart, the Apple chart, the Microsoft chart, the Netflix Chart.
These are great examples of the Mega Cap growth stocks that had this brilliant run, and which was just continuing to push higher and higher. All of a sudden, we had witnessed a change here, about two weeks ago. This is the time when we started to have some question marks in our minds, as we witnessed the change. We would argue that a lot of these stocks had become overbought and hence the change was imminent.
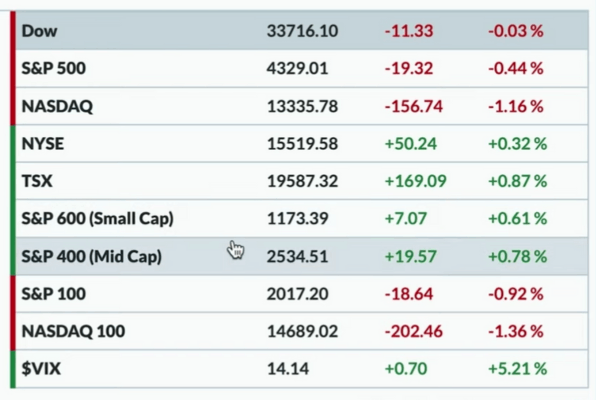
It was this time, when we could see some bearish momentum divergences on the chart of AMD, which is been seen more and more now aswell, as the NASDAQ sort of leads the way to the downside. We saw a little rollover going into the close on Mon, and so the NASDAQ Composite actually finished lower by about 1.2 percent, finishing the day around 13340. Just below that, the S&P 500 closed the day about 0.50 percent lower, that’s just below 4330 and the Dow Jones just basically finished flat for the day on Mon. The Dow Jones was up quite a bit around 33820, but later got sold off, to just narrowly fall in the red.
Mid Caps and Small Caps actually had a decent day to the upside. We think that had a lot to do with the sector leadership. The growthy sectors struggled on Mon and some of the more value or income oriented sectors did a lot better on Mon.
VIX
The VIX ripped to the upside, but was still way low, when compared to where we’ve been over the last 12 months or so. We’re still just around 14 level for the VIX, which in our volatility definition is pretty low because, the average VIX reading last year was sort of in that 20 to 35 range, back in 2021 it was in the 15 to 20 range and now we’re around 14, coming off that 13-handle last week. Therefore, presently though we see VIX with a bounce higher and getting back above 14, but VIX is still relatively low compared to where we had been in recent history.
Bonds
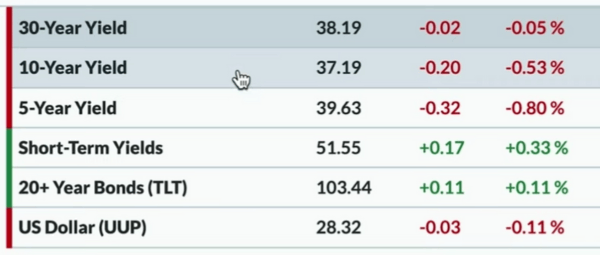
Looking at some other asset classes, Interest rates overall moved higher. The 5,10 and 30-year points moved lower. All the 5,10 and 30-year points all came down just a bit. 5-year yields were around 396, the 10-year yields were around 372.
That 10-year point tends to be the main one we’ve looked at. When we looked at the chart of TNX, which is the 10-year yield, there is not a big directional Trend here over the last couple of months. It’s been sort of sideways and what’s interesting is that, as the language from the FED has been incredibly consistently hawkish, and now as we have paused the rate hikes or we may say that, there’s very much an expectation of the rate hikes to continue,
We think that the real risk for the markets here is when the rates are hiked above and beyond what is needed, due to which, all of a sudden things can begin to get really dangerous, very quickly, because the economy is made to slow down too much. In this situation, all of a sudden, consumers feel the pain and that starts to really affect companies going forward. Although, we haven’t necessarily seen that particularly with the growth names that we’ve been tracking but, the average stock has been struggling in 2023 and maybe that’s a big part of it, therefore for whatever it’s worth, the 10-year yields coming off on Mon.
The Dollar Index did not see too much of a change from Fridays close. The UUP essentially was flat and down about 0.1 percent.
Commodity and Crypto
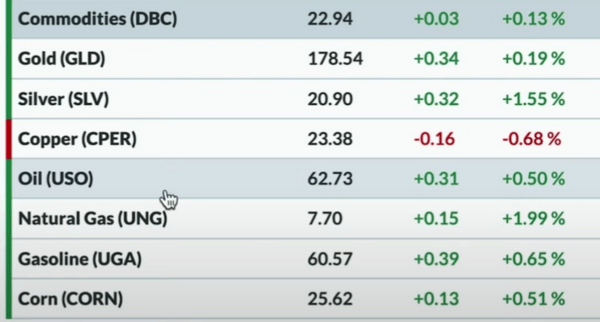
Elsewhere, we had Gold slightly higher but Silver was a little bit more higher and up about 1.6 percent. This might be interesting to see if we get a continued rotation away from risk on risk assets like the equities and a rotation more into defensive areas of the market like Gold or Silver which are certainly an emerging theme to pay attention to. Crude Oil prices bounced nicely on Mon, to up about 0.50 percent using the USO.
Cryptocurrency settled down a bit. Last week, it was all about a new emergence of an uptrend from Bitcoin and Ether. Both of them had tested new highs for 2023. On Mon, both of them came off just a little bit. Ethereum prices in the last 24 hours was down about 2.3 percent. Bitcoin was less than 1 percent lower, but still holding above 30000. Bitcoin at 30000 and Ether at 2000, are important levels to watch
Sector Performance – Dow Jones and Other Markets
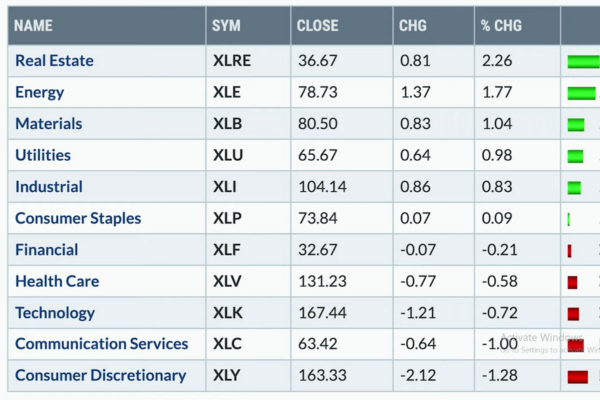
In the sector returns, Real Estate was up the most, up about 2.3 percent. Energy was no.2 and up about 1.8 percent, Materials and Utilities were both up about 1 percent. All these are not the sectors that we’ve been talking about a lot at the top of the list but, it’s always about the Fang sectors that we always talk about being on the top. Unfortunately these three Fang sectors were at the bottom on Mon. Consumer Discretionary the XLY was down 1.3 percent.
Tesla had a really tough day on Mon, after the weekend, and consequently that has weighted heavily on the Cap weighted ETF like the XLY. Communication Services was down 1 percent, Technology was down 0.70 percent. We therefore have defensive and more cyclical leadership at the top, the growth stocks at the bottom and again the way that our benchmarks are calculated is really going to weigh heavily on the S&P, especially on the NASDAQ which is basically underweight with all of the sectors that are on top, as of Mon, and overweight with all of those sectors at the bottom as of Mon.
Therefore, its worth recognizing that when the S&P or the NASDAQ are Up and Down, a lot of times it has to do with some of those sector themes. With that in mind, we look at the XLRES which was the biggest gainer on Mon and was up 2.2 percent.The other one we want to highlight was Energy that was no.2.
Trend and Stock Watch Over Dow Jones S&P and Other Markets
No.1 as we look over the weekend at offense over defense, we think about the rotation within a sector, which is the Consumer sector. Are investors rotating more to the offense ( things you want ) or more to the defense ( things you Need ) ?.
Presently, we are looking at the equal weighted version of this ratio which is RSPD, which is the equal weighted Consumer Discretionary and RSPS which is the equal weighted Consumer Staples. The Relative Strength could be seen bottomed out in July of last year, in December of last year it really started to pop and it was in January from where where it sort of played out to where it is right now. The signal or the ratio is now just starting to rotate lower.
When we put a PPO indicator, that question about the MACD that included on the charts made us think about, what would this indicator tell us?. We understand that, it’s basically telling us “Sell”. It’s telling us that, we’ve now rotated to the upper end of the range and we’ll now be rotating back to the downside, The last time we had this signal was in February, which led to about a 6 to 8 week period and not more, where the defense of Staples really outperformed the offensive Consumer Discretionary.
No. 2, Carnival Cruise Lines were a really rough group on Mon and this CCL on earnings was down about 7.6 percent. This has been one of the better areas of the market here in 2023, outside of Technology. For CCL we had seen higher moves in the past, and now it was a gap lower on Mon, and was overbought until Monday’s sell-off, which is taking it out of that overbought region.
The reason why CCL is so fascinating to us is, because of the way it lines up with the Fibonacci retracements. Taking the high from June of 2021, which is the all-time high for CCL and then taking the low from October of 22, here we can see that we have retraced 38.2 percent of the way and now we’re gapping back down. Therefore, presently we have an expected move as we’re overbought testing a key Fibonacci level.
Finally, some stocks just keep working, Whether or Not we think they should. Whether or not we can debate why Uber should be in an uptrend?. Uber made a new high for 2023. On Mon, it made a new 52-week high and was up 2.50 percent. We are inclined to follow charts and follow trends like these, until proven otherwise that the trend is still positive.