
Friday Market Recap – Dow Jones and Other Major Indices
On a day like Fri, the Dow Jones and Market continued to push onward and ever upward. The market reached the sky and Beyond. Apple is now a three trillion market Cap Stock and that’s just part of the story. The AI driven frenzy continued to push risk assets higher, particularly the growth areas of the market but, it wasn’t only the growth stocks to push higher on Fri. Today in our market report, we’ll focus on a couple of other sectors that also made a new high to end the quarter.
In a bull market phase, like the one we’ve certainly been here in 2023, especially in the second quarter, as we came to a close on Fri, we had risk assets pushing to the upside. On a day like Fri, that was the end of June and also the end of Q2, it was pretty normal to have the so called window dressing. This is the end of the quarter. This is when professional money managers have an opportunity to sort of make things look really good and demonstrate that yes, we’ve been in the right trades and so things that have worked off often sort of work a lot of times. There’s a rotation to sort of an ideal configuration for the portfolio and also if any sort of crazy bets that money managers may have taken, they try to always re-engage them after the 4th of July holiday. Therefore, certainly part of the rally that we saw through the course of the day on Fri, could be attributed to that sort of quarter and window dressing.
Next week of course we have a light day on Monday,then a holiday on Tuesday, then we sort of get back to normal, in the middle of next week in 2023. For now, we’re seeing the growth areas of the market like Technology, Community, Consumer Discretionary continued to press the long side or continued to push higher with higher highs and higher lows. What sort of signs if any, do we recognize about those Trends that seem abating,iswhat we wonder.
Dow Jones and Major Indices
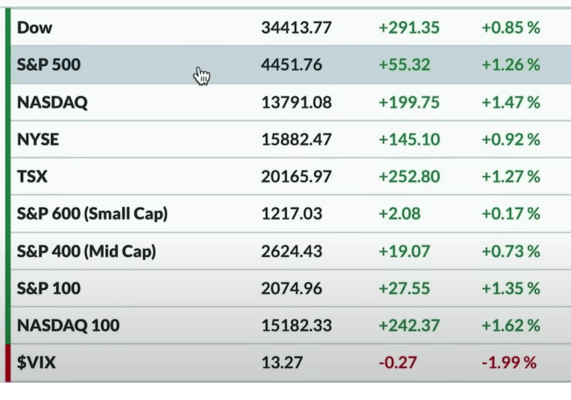
As we look into what happened with the Major Averages, on Fri the S&P had a decent update pushing into the close just above 4450 and more towards the highs of the day. It was a really nice rally through the course of the day on Fri. It sort of stayed elevated whilst going into the closing moments and was up about 1.3 percent from Thursday’s close. The NASDAQ Composite lead the way higher up 1.50 percent, the Dow Jones was up about 0.9 percent. It was worth noting Mid Caps was pretty good hanging along with the Dow. The S&P was only up 0.2 percent and this is interesting because, one of the things that we’ve been talking a lot often is, a sort of this idea of narrow leadership which we think was an obvious truth a couple of months ago, with the sort of Mega Cap Technology, Consumer names and then everything else.
There is this big dispersion between those name for now. Those leading names have still really outperformed everything else but, we have started to see some breadth conditions that have really started to improve. On a day like Fri, Small Caps did not really have that sort of move and we think that’s again a part of the window dressing. If there’s any sort of really crazy speculative bets that you have made as a money manager then, now’s your time to sort of ride that ship and make sure that you will be locking in your Holdings at the end of the quarter. It looks just like what your clients might also be expecting you to do the same. You may then go back to doing some out of Benchmark bets that might be a little more speculative with greater risk but also have greater potential returns.
Therefore, this is a pretty common behavior here for the end of the quarter but, something very interesting to watch would be the underperformance of Small Caps and that’s usually not a great sign for for risk assets.
The VIX
The VIX continued to go lower. The volatility picture continued to show that this is a slow and steady uptrend in a low volatility environment, which is very much like 2021. The current VIX ratings are actually lower than we were through all of 2021. The current VIX scenario is like going back to sort of pre-2020 or back to like 2016-17 sort of numbers. if we look at a long-term chart of a VIX, we see that the VIX used to be pretty common between that sort of 10 and 20 range. It should be noted that, we had be been incredibly high on the VIX, recently in the last couple of years.
Bonds
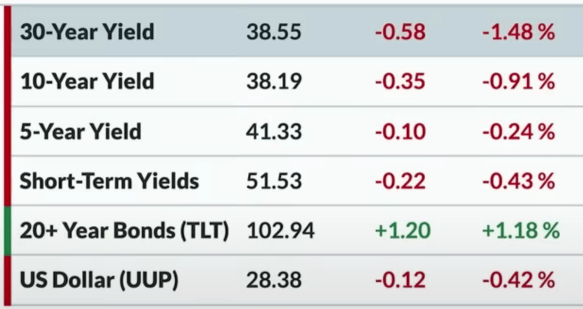
Whilst looking at some other asset classes, we could see the yield curve overall moving lower on Fri. The long bond yield or the 30-year was around 386 and 10-year yields were around 382. So for now, we had interest rates coming off a little bit. Bond price that are pushing a bit higher, might be another thing to think about in the coming weeks as we going into that FED meeting in July. The Dollar Index did not have too much of a change and was down about 0.40 percent, that’s using the UUP which is a bullish Dollar ETF.
Commodity
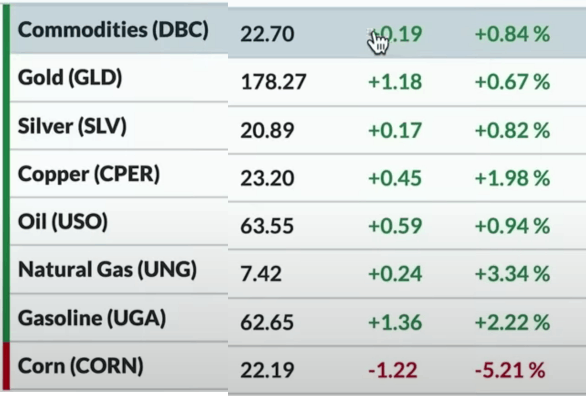
In the Commodity space, the DBC was up 0.8 percent. That’s really a broad commodity ETF, with a bit of an Energy sort of weight in it and also really covering a broader scope of the Commodity space. Precious Metals were all in the positive. We had Gold and Silver that were both up, about 0.70 tp 0.80 percent. Fri was actually a surprising strong day because, given the fact that equities and other risk assets moved to the upside on Fri, then usually on such a day the Gold and Silver tend to be a little more defensive but unusually, both of these were also doing just fine on Fri. Energy prices moved higher, the only thing that was down was CORN.
Cryptocurrency
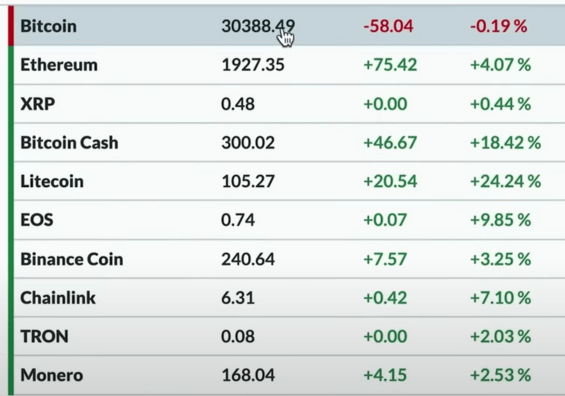
Finally, in terms of the Cryptocurrency space Bitcoin was just slightly down. All the other top 10 cryptocurrencies that we usually track were all in the green. Bitcoin is still holding steadily to around 30390. Ethereum price is just below 1930 and still below that key 2000 level or the level we’ve talked about a number of times in our past Daily Market reports.
Sector Performance
SECTOR PERFORMANCE ON FRI AND FOR THE WEEK
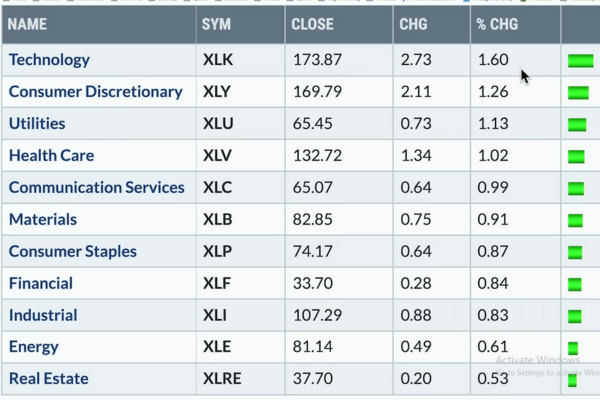
As we look into the sector movements for Fri, the Technology sector and Consumer Discretionary was number one and number two respectively. Technology was up 1.6 percent. The XLK, which is one of the top performers year-to-date, continued to show strength and continued to hold that sort of top tier recognition. Utilities were No.3. The 3 sectors at the bottom were Real Estate, Energy, Industrials, Financials Which were all about the same. Although at the bottom, all of these were still positive though, and the worst performer Real Estate was still up, about 0.50 percent. On Fri therefore, we were certainly getting that sense, that a rising tide lifts all boats,which we could also see on a day like Fri.
Weekly Analysis – Sector Review
Weekly sector review When we see the performance of the sectors from last Friday to this Friday, what happened surprisingly was that, over the last five days it wasn’t Technology, but it was Real Estate at the Top, No. 2 was Energy, No. 3 was Material. We therefore, had those growth sectors underperforming. In this week gone by, the Technology sector where there is a sort of gross, could be seen reinitiating or reasserting its leadership position. REITs actually had the best week of all followed by Energy, then followed by Materials.
So we’re now starting to see some of these cyclical sectors or we can usually them more late cycle leadership sectors, are now starting to really perform pretty well. We would argue here that, the bull case of the markets from here onwards would not be just Apple if it continued to go higher. Although Apple going higher may certainly not hurt, we think that it’s some of these other sectors that have started to do better as well. We think it’s things like Industrials and Materials and Energy, which were the things that have been struggling on an absolute basis that have now started to improve and we’re seeing some swings higher across the board in those areas on the market. Now. when we look at the quarter or look at Q2, we think about the end of March to the end of June. This period certainly tells a story about the strength in growth stocks of Technology, Consumer Discretionary, Communication Services with No.1, No. 2, and No.3 position. Again, these are Cap weighted ETFs therefore, it’s really leaning towards the biggest names out there but, we can see that the XLK or Technology sector was up 17 percent, followed closely behind by Consumer Discretionary and Communication Services had a decent quarter as well.
Therefore, if things had to do well relative to the benchmarks, in the second quarter of 2023, then it was simply its own large Cap growth which ensured that it did exceptionally well. In the Year-to-Date performance also, that’s been an incredibly powerful strategy that has proved well for these sectors with Large Cap growth. Some of the other sectors, of course are still down or still below the water line for the year namely Utilities, Energy, Healthcare, Financials. Inspite of some bounces in the month of June, they still provide a negative return, Year-to-date.
Weekly Analysis – Dow Jones Other Major Indices Bonds Commodity
As we try to understand what has changed from last Friday to this Friday, in the major markets over this time, the S&P was one of the top performers, which has actually been a little unusual here recently because it had been a little more choppy or a little more differentiation for the S&P but, for now the S&P had a pretty strong week, finishing the week up about 2.3 percent. It was only one thing that outperformed the S&P and that was actually the Russell 2000 or the IWM ETF, which finished up about 3.7 percent. Everything else underperformed the S&P. We have the NASDAQ 100 and Crude Oil prices which ended up being right about the same, around 1.8 to 1.9 percent higher for the week. The Emerging Markets EEM was up 1 percent. Flat for the week was the Dollar and Gold. The Dollar came off of on Fri. Gold rallied in the end of the week. Both Dollar and Gold really didn’t move anywhere, they were sort of neutral and unchanged for the week. The underperformed ones that were actually down on an absolute basis were the Bond prices that finished the week down about 0.40.
Trend and Stock Watch Over Dow Jones S&P and Other Markets
The S&P 500 is again making new highs for the year. Going into the end of the second quarter, it’s been a strong second quarter after a strong first quarter with some notable pullbacks but, overall the position of the market is strong on all time frames that we would be worried about. So overall the trend that we have to follow is that to the upside, until proven otherwise.
Howeve, If there’s any issue with this trend then, it’s the equal weighted S&P that is not as strong as the Cap Weighted S&P and that’s again just the nature of the biggest stocks doing a Lion’s Share of the gains and we will monitor this continuously to see if this continues to improve. We think regaining the February highs would be a great bullish sign to have at the beginning of the third quarter. Other things that we look at here in terms of breadth is the percent of stocks that are above their 50-day moving average and the number is around 74 percent. That’s a bullish range and that’s a bullish number. We are looking to see if and when this gets above 80 percent, because that’s what happened at the August Peak, that’s what happened at the December peak of last year and we would be very much interested as we sort of get to more elevated numbers of that range.
The bullish percent index for the S&P 500 is currently around 67 percent and that’s looking at the percent of stocks with a bullish point and also looking at the figure chart that’s getting close to 70, which has often been the very sign of an end to the Move.
Finally, we see two sectors that finished strong going into the end of the second quarter viz the Industrial Sector and the Materials sector. When we look at the performances here over the last previous Periods, we are surprised to see that things like Industrials and Materials are at the top of the list. In this week, we’re seeing a lot of strength because the XII just made a new high on Fri. The Materials sector is not on a new all-time high, but it is certainly at the upper end of the range that we had been for the last quarter. These are areas of the market that had been underperforming but now as they continue to do what they are doing presently then, that is showing us renewed strength and potentially renewed opportunity.