
On Thu, we had the Dow Jones, NASDAQ, S&P, Small and Mid Caps move higher together. we also saw some of the potential mean Reversion. We saw stocks in the Energy and Materials space bouncing a little bit to the upside.
If we like the idea that the current market is moving higher, driven by the biggest names in Technology and Communication Services then, we probably enjoyed the markets on Thu, just like any other day in 2023. We say this because, we saw more of the same, thatdgap between the top performing stocks and the stocks not performing to the desired uptrend. The same stocks like Nvidia and Apple and Microsoft continued to spread and also stocks like Meta Amazon continued to push to the upside, having nice swings higher and continuing to press to the long side or press to the upside. We saw other areas of the markets struggling. We are today, talking about the pullback in Gold stocks. In the Energy space we saw a bit of a bounce in some of those Energy stocks.
Market Recap – Dow Jones NASDAQ S&P Small and Mid Cap…
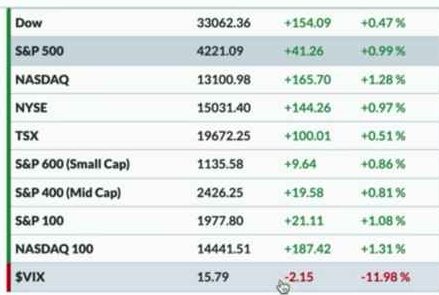
The S&P and the NASDAQ, again both had another nice update although, we had a bit of a pullback in the last hour of trading but, overall the bullish damage had been done. The S&P closed the day just above 4220, that’s up about 1 percent from Wednesday’s close. The NASDAQ Composite closed even higher, Up actually about 1.3 percent from Wednesday, and that puts the NASDAQ Composite to 13100. On Thu, Mid Caps and Small Caps both, were up as well and were about the same as the S&P and about 0.89 percent.
The VIX
The VIX pushed a lot lower on Thu. The VIX is below 16. VIX was down to about 15.8 and that’s a full two points down from where we were on wednesday, which was just above 17 the previous day.. So we sort of continued to see this environment where Mega Cap growth stocks are doing the Lion’s Share of the gains and correspondingly volatility remaining fairly low, and we see a lot more like 2021 than 2022 of a volatility regime. Therefore, overall this Market may end its raging uptrend at some point but, it did not do so on Thu.
Bonds
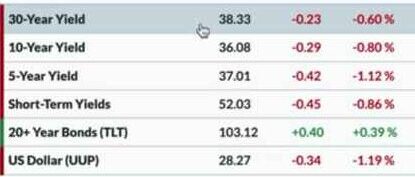
When we look at some of the different Asset Classes, Interest rates overall, all moved lower. The 10-year yield was around 361, 30-year yield around 383 and that’s down quite a bit from the four percent that it was in the last Week. Therefore, we are currently seeing bond prices rally just a bit as rates are coming down.
The dollar Index actually moved down by about 1.2 percent and that’s using the UUP. Thu was one of the worst days for the Dollar. We have actually seen for quite some time that the Dollar has been on a nice swing higher and certainly it was in the month of May.
Commodity
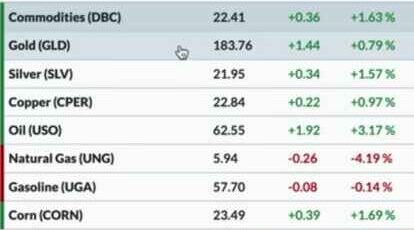
Looking at Commodities, we could see a lot of green here on Thu. Some of the Energy ETFs Were down a little bit, like natural gas but Commodities when measured by Gold and Silver were doing just fine. The GLD was up 0.8 percent, Silver price is up 1.6 percent, Energy worked up a little bit as we look at Crude Oil prices and the DBC was up 1.6 percent on Thu.
Cryptocurrency
Cryptocurrency Cryptos were a little bit mixed but overall more negative than positive. Ethereum was not too much different from Wednesday and was down about 0.1 percent Bitcoin is actually pushing below 27000 and that might be important because right now we are a sort of at the lower end of the range where we had been at the 27000 levels for quite a time. What’s interesting about Bitcoin and ethereum and others is that they are not really moving up anymore and neither are they really breaking down. They don’t seem to belong to either of the Camps We can say that, today when we think about Cryptocurrencies and bond prices, we think more sideways about them, than directionally up or down and our thoughts therefore speak a little bit or a lot more about the current market environment that we’re in.
Sector Performance – Dow Jones NASDAQ S&P Small and Mid Cap
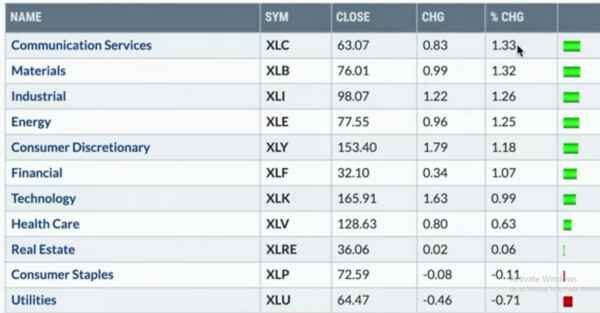
A real quick look on sectors shows that Communication Services was the top performer on Thu. When we look at names like Meta, we know stocks like these are making new swing highs. Yet again on Thu, stocks like these were driving the XLC up by about 1.3 percent. This is the ETF, which Is dominated by two stocks that make up about 50 percent of the other waiting stocks in the XLC.
Materials was number 2 and Industrials was number 3, followed by Energy. All of these were up 1.2 to 1.3 percent, which is a decent update, particularly for things like Energy, Materials, and Industrials which had been beaten down, but they are actually pushing back to the upside now. We could see Some defense in the form of Utilities, Staples and Real Estate. At the bottom of the list here was Utilities and it had the worst day of them all, as it was down about 0.70 percent from the previous days close.
Now, as we talk many moons about the market rallying, we find that the current breadth conditions are becoming less and less constructive. In the last month and In the month of May, it had really become exaggerated, with the NASDAQ 100 leading the way higher, pushing ever upward, while the S&P just starting to break out above resistance potentially, while the breadth conditions are all going down. Now, Can the market go higher on weaker breadth? of course, and we’re actually seeing that happen, just recently. in the month of May. Our concern is when the generals continue to do all of the heavy lifting then, at some point either the private or the end of the the Infantry have to start participating or there has to be something that breaks about this and there has to be this awareness amongst the infantry, to break this. Currently however, there is not any agreement between the Generals and the Infantry, and therefore a lot of stocks are underperforming and this can be a challenge. By the way, the advanced decline line on the Small Cap Index, had just made a new low for the year on Thu, and that is not a bullish development atall.
Stock Watch Semiconductors ( Dow Jones NASDAQ S&P )
Next, particularly talking about Intel, which is one of the semiconductor names, ha been struggling. Other areas of the semiconductor space have actually done very well and therefore certainly Semiconductors is one of the strongest places year- to- date in 2023. When we look at the chart of “ON” semiconductor, this is one of the many names which had a decent day on Thu, and was up another 5 percent on Thu. What’s interesting about “ON” is, When we look at the trend overall and not just today’s move, Do we get above resistance?, What’s the trajectory of the overall trend?.
As we take a step back and look at the last 1.5 to 2 years, we would probably describe this as a consolidation pattern that is resolving to the upside. Another interesting thing is, that the relative strength is improving and the RSI which is a good measure of momentum is remaining above 50. These are sort of bullish configurations for sure. As long as we continue to push higher, as long as we’re above 2 upward sloping moving averages, as long as the momentum stays constructive, we can say things overall are probably pretty good. We are also waiting to see if we get any sort of divergences and when you have a stock making a nice move to the upside, we can always look for new highs on weaker momentum. Although, we are not sure if that’s how this is going to end up, but we are also certainly watching Owen and others for that same sort of development.
Stock Watch Energy ( Dow Jones NASDAQ S&P )
Finally, as we finish off with the Energy sector, the XLE that we highlighted in our market recap had some of the Energy stocks bouncing back to the upside on Thu. The SLB, Halliburton and a number of others had a decent day on Thu, but let’s put it into proper context. What has happened over time with the Energy sector? and what are some of the ways that we could identify potential mean reversion move to the upside?. When we look at the chart of the XLE and as we focus on the March low, we notice that we are just above that level and it’s right around 75 dollars on The XLE. Now, can we have a day like Thu that continues?, Do we have more days like Thu?, Do we get a bit of a mean reversion?, a double bottom of sorts for some of these Energy stocks. The XLE right now, is not as exaggerated or is not very clear of a bullish divergence but, we certainly saw that in some of the individual stocks within the Energy sector.
What’s interesting about the XLE, we would say is, the fact that the relative strength has been so negative therefore, the things that start to make this chart look from being a consistent underperformer to something with promise then, number one we can make a higher low and we may be doing that, and that’s why 75 is an important level to watch for Energy. We will have to see if we can hold that, or does the momentum start to improve or remaining below 50 on the RSI, Can we get back above there?. The relative strength has been going down now, and most sectors had negative relative strength except for Tech and Communication Services. Do we get a turn higher for Energy?. If and when, we see those three things happen, Energy may be a good opportunity. Having a day like Thu, it makes us feel that, there might be some opportunity for that to come at some point soon.
Credits
photo credit by
The image insets used in the Featured Image for this post is obtained with prior public/paid subscription or permission and therefore is credited to the following entity or entities, The final Featured Image in this Post is however the Artwork of USA TRENDING HOUR (UTH). All rights are reserved to this artwork or final Featured Image of this Post and any reproduction or use of the final Featured Image without prior written permission and consent will be dealt with strict penal action as per international laws.
Featured Image :
Final Feature Image of this post is the artwork of USA TRENDING HOUR ( UTH ).
Featured Image Inset Elements by :
Other Content Image Element(s) by :
Element Name : photo credit