Image Flickr.com
The Dow Jones S&P NASDAQ and Other Major Indices
Lets start setting up for our Success this week. We will also see what changed on Mon, with one of the most leading stock Apple. Apple had pulled back big Time. There is no denying that the major averages involving Dow Jones and the others are pushing higher. We had seen the S&P and the NASDAQ making new swing highs last week. Today we are going to look at the stock charts and make our own assessment about the sustainability of those gains from last week.
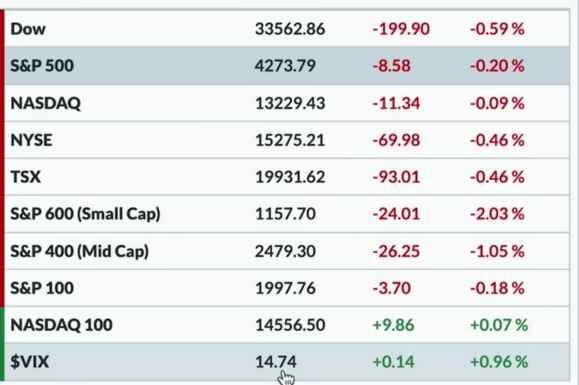
Starting with the major averages,there was under performance by Small Cap and not by a little bit but by a lot. The Small Cap index was down about 2 percent on Mon. S&P 500 was down about 0.2 percent to 42.74.
Just below that was the NASDAQ Composite, which although was up through much of the day but, actually ended up just barely negative. The NASDAQ Composite was currently at 13230 down about 0.10 percent, Mid Caps were down about 1 percent, Small Caps were down about 2 percent.
Therefore on Friday, we feel like it was a return to some of the cyclical leadership where some of those areas that have been underperforming like Energy and Financials and Materials, had just begun to surge on Friday and were up to 3 percent. However, these were back to normal on Mon, with the Small Cap index and a lot of those same sectors Struggling.
Small Caps again have been a chronic underperformer in 2023, and that has been arguably the story and one of the key narratives is the Mega Cap dominance of these markets. We are seeing more of that, although as we mentioned in the intro that one key Mega cap named Apple was having a tough day on Mon, as they had their developers conference on Mon.
Volatility in Markets – Dow Jones NASDAQ S&P Small and Mid Caps
Volatility continued to go lower. The VIX overall which was pretty low and actually down just below 15, was now just slightly up on Mon but, on Friday VIX had really pushed to the downside. Therefore what’s interesting is we are again very much in a 2021 kind of environment in terms of the relationship between the Equity indexes and Volatility.
We are seeing the major indexes move in a higher stepwise motion to the upside with volatility remaining fairly low. In our previous reports,you may recall that we were talking about whether the VIX would get below 20. It Is actually well below 20 and even below 15, now. it’s currently down around 14.7. Therefore a scenario of low Volatility with strong stocks Is pretty encouraging for Bulls we would say.
Bond
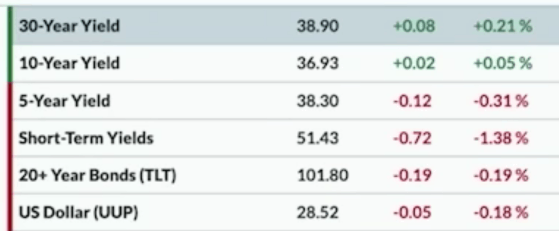
Next, we talk about high yield spreads and also get a little bit pretty bullishly positioned at the moment in terms of the yield curve. We actually had a slight steepening of the curve on Mon, with short-term yields coming off a bit alongwith the 5-year yields as well. The 10 and 30-year points actually got slightly higher, although not by much.
Therefore, we saw a little bit of a return that was more than a normal. Here, let’s be clear that, its still very much inverted with the short-term. Short-term Point around 5.1 percent and the long Bond currently around 3.9 percent, therefore we still have a downward sloping or what’s called an inverted yield curve.
This is usually a very consistent indication of a recessionary period that suggests economic weakness or the lack of economic growth. That dollar was not too different from Fridays close, with the UUP down about 0.2 percent.
Commodity
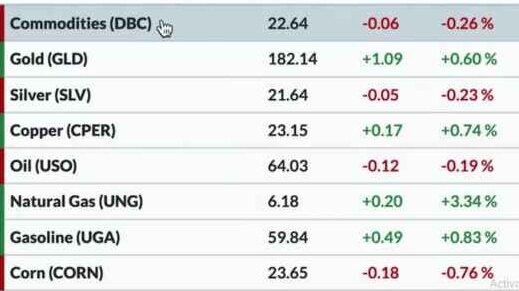
Commodities actually were quite mixed on Mon and we could see that the DBC, which is a broad commodity ETF with certainly more of an Energy Focus, than other parts of the commodity complex was down about 0.25 percent.
Gold actually was up 0.6 percent. The GLD is potentially about bouncing off of the lower end of a channel.The rest of the Commodity space was sort of mixed with a little up, a little down.
Cryptocurrency
In terms of cryptocurrencies, a lot of red was seen. We are getting into another sort of regulatory headline about cryptos and that is the biggest risk to the crypto space, besides general stability and general buy-in adapting or people adopting this new technology and these different forms of exchange. On Mon this was seen as real and affecting all Cryptos.Bitcoin was down 5.50 percent. Bitcoin was now down to 25600 and a littel above that. Ether was still above 1800, but not too far above that and that’s down about 4.50 percent. The rest of the major cryptos that we usually track were down about 5 to 10 percent on Mon.
Sector Performance – Dow Jones NASDAQ S&P Small and Mid Caps
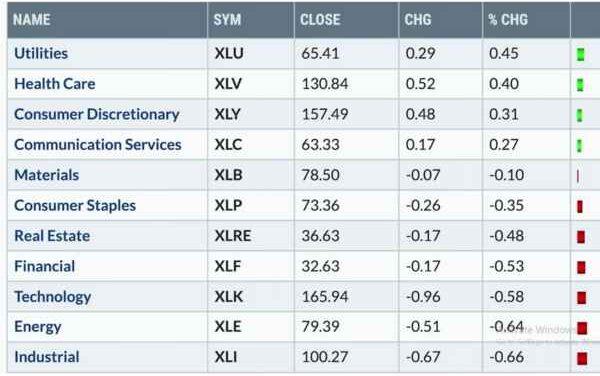
Finally at the end of the closing on Mon, it was actually quite a lot of movement in the sector returns. On Mon, Utilities ended up at the top of the list, followed slightly behind by Healthcare and Consumer Discretionary. All these three, were up about 0.3 to 0.5 percent. Seven out of the 11 industry sectors or economic sectors were down on Mon, with Industrials, Energy and Technology all being down about 0.60 percent.
Watch Time – Assets and Stocks In Dow Jones NASDAQ and Other Major Indices
Stock Watch When we look at the stock of McClellan Oscillator, we saw a Spike above zero on Friday. We are pretty encouraged by the fact that the breadth has improved. To that point, we were very curious of what will happen at the end of the day on Mon because, we had a bit of a retracement on a lot of those names that were working. The breadth was a lot weaker on Mon and therefore we will be waiting to see if we can get that one day reversal back and below the zero level,
Next, as we talk about Gold, we take a midpoint to look at a regression analysis over a time frame. We do this, to understand where the trend has been. Drawing some parallel lines above and below that regression Channel.
As we draw a parallel line or draw a trend line from the November 2022 low line, and up with the March 2023 low, then we can see that this line is, up pretty much, in the space around the last couple of weeks, on the GLD, now. This is after coming down from the upper end of this channel in March and April and early May.
On Friday it seemed like that, it was now a breakdown and we waited to see if could get a follow through on Monday, but we did not. On Mon, we actually bounced back to the upside. With the RSI remaining above 40, it indicates that we’re in a bullish phase and we’re at the lower end of the channel. We want to see a little further of a breakdown and for GLD, a 176 would be our general sense of the next step.
Finally AMD or Semiconductors, certainly have been one of the stronger groups. We can see that AMD has rallied to a 61.8 percent retracement and that’s important because that’s the same retracement level for 4300 4325 on the S&P 500. From there we’ve pulled back out of the overbought region. Now, Can we return higher and break above 125?, is the next question for semiconductors and for AMD.