
Image by Peggy und Marco Lachmann-Anke from Pixabay
Wednesday Market Recap – Dow Jones and Other Major Indices
Wednesday was an unusual day as we had the FED Meeting. The FED did not change the target rate on Wed but, the projected future path, of where things may be headed for, is very much of a guess. On Wed, although the market was usually pretty quiet beforehand but, it is true that there was a lot of noise during the release and during the press conference that was held at the end. At the end of the day on Wed, the S&P was essentially flat from Tuesdays close. A lot of the trends, a lot of the momentum, a lot of the breadth conditions that we had been talking about in our previous articles, is still very much in play. In our Market Highlights for Wed, let’s look at what particular action, actually did to some of the charts on Dow Jones and other Major Indexes.
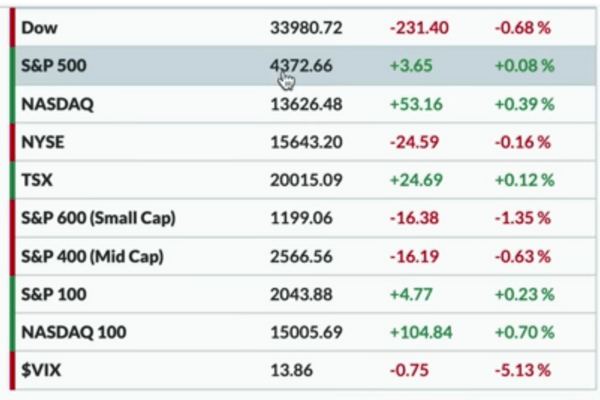
The S&P 500 as we mentioned had a choppy day. Although, In a little two-day preview chart, we could see quite a lot of movement but, at the end of the day, we were not too far from where we were on Tue. At the close on Wed, it was all about digesting what we heard but, there was no significant move and we think that the positive and negative thoughts or comments or reactions in the end netted it out to a choppy but directionless day, in terms of the overall movement.
The S&P finished up just about 0.1 percent from Tue, just below 4373, the NASDAQ Composite actually pushed a bit higher but only about 0.40 percent and the Dow Jones was down about 0.70 percent on Wed. Small Caps was the worst performer of this group, with the S&P 600 Small Cap Index which was down about 1.4 percent and just below 1200.
The VIX continued to go down therefore, the story of 2023, in terms of volatility has been a slow and steady uptrend. When we take a step back and look at the charts on much lower volatility, 2023 volatility wise looks a lot less like 2022 and 2020 looks more like 2021.
Bonds
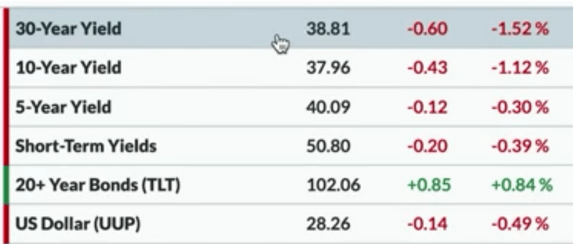
Elsewhere, with Interest rates at the end of the day, the yield curve came down, By the end of the day, we saw a lot of choppiness during the press conference but by 4 pm Eastern Time we saw a sort of push to the downside for race, as bond prices went higher. Tenure yield finished the day at around 3.8 percent, the 30-year yield was just below 3.9 percent, five-year yield was parked just above 4 percent. Dollar Index was down about 0.50 percent, that’s using the UUP ETF.
Commodity
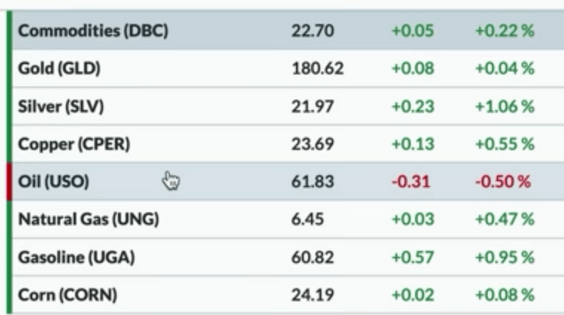
It was a mixed bag in terms of Commodities, particularly for Oil prices, which went down on Wed. By the way Energy sector was one of the worst performing sectors, out of the other sectors on Wed. The rest of the Commodity space was higher. Gold prices actually held steady so this was not like a big move towards offense or towards defense. At the end of the day it was kind of choppy and when we look in a moment at the sector leadership we will see that very much played out when we think about the sectors and what bets were actually being made during the course of the day.
On Wed, Cryptocurrencies for the most part were in the red but, there were no severe movements. Bitcoin, kind of came off through the course of the afternoon here in the Equity trading session and was just above 25740, which wasdown 0.7 percent. Ether was down 1.4 percent from Tueesdays Close.
Sector Performance
Trend and Stock Watch Over Dow Jones S&P and Other Markets
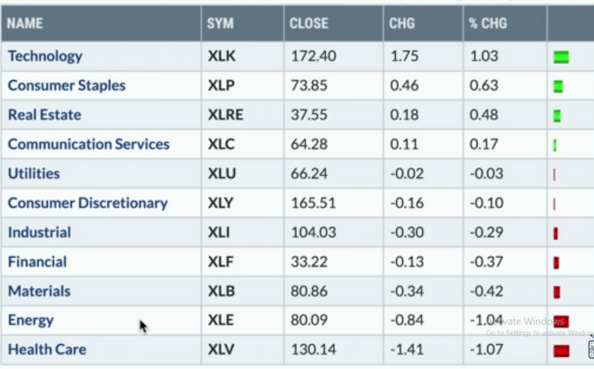
As we quickly look at the Equity sector ETFs, and what happened there, we saw the Technology sector lead the way higher up 1 percent and it was interesting to see some of the leadership names like Nvidia as they continue to just push higher, and right onward and ever upward.
Second though, was Consumer Staples and for much of the day the XLP was actually the top performing sector, while XLK actually overtook it by the end. Staples actually moved higher by about 0.60 percent, followed by Real Estate. Therefore, no.2 and no.3 on Wed, were up about 0.50. and 0.60 percent and these were the fairly defensive sectors.
At the bottom of the list, we had Health Care and Energy, the 2 struggling sectors in 2023 that have been chronic under performers this year with no real change. If we look at some of the Energy stocks, we know the XLE had tested it’s 200-day moving average, but not getting much above there. A lot of Health Care names actually look fairly weak, on a relative basis for sure.
What is interesting about the XLK or the Technology sector, that we are talking about and which was the top performing sector on Tue is, Technology is at all time Highs, A lot of individual names like Apple, Microsoft and others are sort of facing the same issue and they are all sort of, in that similar boat. In this situation we Would say that, just the simple fact that we are at the previous high, is not enough.
That tells you to be ready for some sort of movement but, we look at what actually happened at the 2021 high we see that, no.1 we had a bearish momentum divergence, higher highs in price, lower peaks in the RSI, lower peaks in the PPO or the MACD indicator. All of those started to suggest on those last highs that the momentum was waning. We have not seen that yet and we are at present actually seeing the momentum remain fairly strong. Therefore, this tells us to look back and recognize what often happens at a market top. It tells us to look out for these similar signs of exhaustion that we discussed above.
Now, what we would be wary of is, if we keep making new highs and the momentum starts to rotate lower, additionally we make new highs in the PPO and the indicator starts to give a sell Signal, it is then, that we can start to make a lot of noise about skepticism of any further upside.
Within the HealthCare sector, Boston Scientific BSX actually gapped higher on Wednesday. It was up about 4 percent, even while much of the health care sector has been languishing. The reason why we want to mention this is, we saw a potential bearish momentum divergence for the S&P 500 but, look at what we are actually seeing right now over the last couple of months for BSX. This is an example of how that actually plays out. For BSX, higher highs in price from April to May, lower peaks in momentum April through may as well. It’s pulled back, but now we have gapped higher.
Now, we are gapping up to that level where we have seen previous exhaustion in that bullish scenario. We would be wary of further upside. A push above 54 on stronger momentum starts to make this a much more constructive stock chart but, for now we would be more skeptical of upside potential because of the previous exhaustion signal.