
Image by Flickr.com
Wednesday Market brief – Dow Jones and Other Major Indices
On Wed, the S&P 500 continued to test 4300 but, It did not really follow through, yet. Dow Jones was almost unchanged. The challenge in the market right now, is that we are testing the resistance level and not just a kind of resistance but, arguably the resistance at 4300 to 4325 level. we’ve focused in on that level for quite some Time.
Now, the question is, Do we have enough momentum and enough mode of power, to wade through that resistance?. We may say that this is still very much an open question, when you have stocks like Meta and other leadership names that have now started to pull back a little bit. Is that enough?… Do we have enough of a rotation, that is away from the growth leadership, to push through this key resistance level?.
Let’s look at the Stock charts in our Market Recap and let’s see what actually played out. This will help us understand, how Wednesdays market performance relates to the long-term trends.
Market Recap – Dow Jones NASDAQ and Others
On Wed, the S&P 500 opened a little higher and as we first looked at the the market, right from its opening, we saw this surge right back upto 4300. Therefore, just alike many days in the recent past, we guessed this to be the day and time, where we shall now really power above 4300 and get above this new resistance range of 4300 but, this was not the case to be On Wed.
On Wed, we rotated lower, we actually made a low for the day, at around 1 30 p.m Eastern time and then finished at the lows of the day around 4267. That brought the S&P down about 0.40 percent from Tuesdays close. Therefore, we are still near the highs of the year, but not really following through to the upside. We are stalling out a little bit and we would argue, a lot of that has to do with the sector movements on Wed.
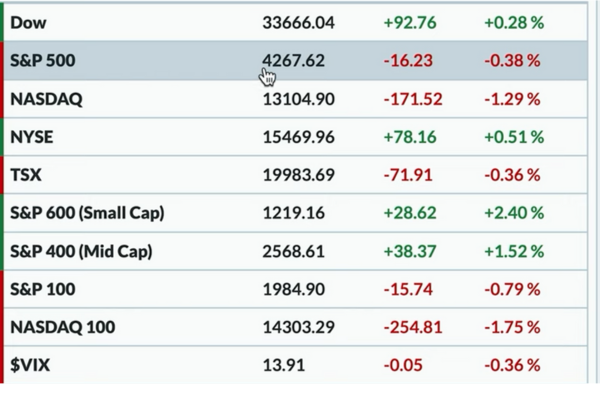
On Wed, the NASDAQ Composite was leading the way lower down 1.3 percent, the Dow Jones was higher up 0.3 percent. We therefore had a familiar scenario, where recently where the NASDAQ was down but, the Dow Jones went up and of course the S&P was most likely to be going down in that scenario, because it’s pretty growth oriented.
All Things Considered Mid Caps and Small Caps had a decent day with the Small Cap S&P 600 up 2.4 percent. Therefore, if we guess about what prevents the S&P going further then, we have to understand that, on days where the Small Cap Index is up over 2 percent and the NASDAQ is down over 1 percent, that’s not going to be the day when we would be really following through.
Even though the S&P was down a little bit, the VIX actually moved lower on Wed, and was now down below 14. Again, with the VIX, we are now firmly down in the range that we were back in 2021.
Bonds
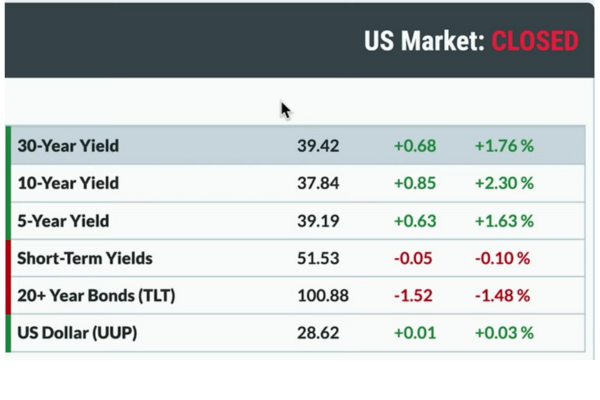
The Interest rates for the most part, moved higher. The short end of the curve remained relatively stable. 5, 10 and 30 year points all pushed to the upside. The 30-year yield is getting closer back up to 4 percent and at the end of the day was around 394. The 10-year yield was around 378. The Dollar Index had no real change from Tue. We basically saw bonds sell off with the TLT down about 1.50 percent and that of course means, interest rates are moving higher and that’s the environment we had On Wed.
Commodity
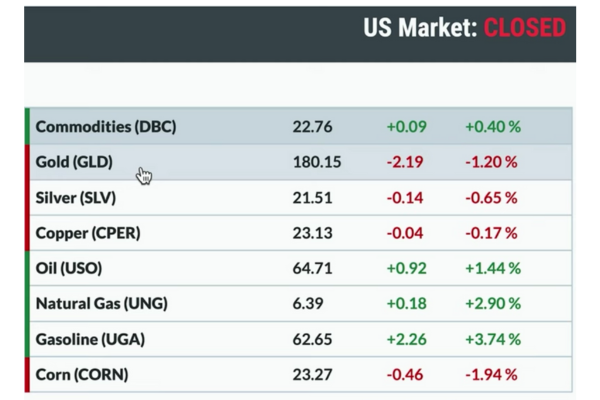
Also moving lower on Wed was gold and silver precious metals. Regarding gold and Silver, we may be able to declare that we’ve broken down out of that trend Channel that we’ve been tracking for a number of months. The last four to six months, Gold has been in a nice sort of steady incline, moving Higher with higher highs and higher lows and that maybe starting to change. For gold, we are certainly breaking below the trend line support. This week Silver moved to the downside, as Well.
Other parts of the Commodity space did fine. Particularly Energy with Crude Oil prices moving higher, Energy had a decent day as Well.
Cryptocurrency
Cryptocurrencies remained probably the most Stock volatile part of the market. If we like volatility and uncertainty then, we shall very much be enjoying 2023 and certainly the last week or two. Bitcoin and Ether, both of them were down on Wed.
Bitcoin was down about 3 percent, Ether was down 2 percent. On Cryptos, we are currently running into regulatory risk, volatility risk issues and that of course is going to put some downside pressure on Cryptocurrency. For now, after Tuesdays move back to the Upside, we saw Bitcoin pull back on Wed.
Trend Watch – Assets and Stocks In Dow Jones NASDAQ and Other Major Indices
Some of The sectors like Energy and Financials that have been struggling Have started to rotate to the upside. While we think that there is still a lot to prove, we see that in the short term there is a nice rotation on the higher side.
Right now we are looking at a ratio of two different ETFs, that is the RPG and the RPV. You may probably, not be familiar with these, but this is a different way of just looking at growth versus value. A lot of stocks actually are double counted. They are considered both growth and value because, they kind of fit the definitions, loosely in both Cases. This is just looking at stocks that are purely growth, purely value.
Therefore, think of like an emerging Technology stock is a classic growth opportunity, a very defensive one like utility or Staples as a value play. We find that, this ratio has now started to rotate lower. In offense versus defense, the XLY versus the XLP, the equal weighted versions of those ETFs rotating higher as well.
We see here that, growth which had been certainly the strongest part of the market through May, has now started to rotate Lower. This is more concerning though and may prevent the S&P to push through the resistance of 4300.
Looking at 3 things, the Relative Strength of the XLU Utilities sector versus the SPY, the Price of the XLU and finally the RSI measure of momentum, can we say that the Utilities is bouncing out of an oversold Region.
We can see the bounce in Price but, does this mean that the bull Market’s over because Utilities are starting to work?. However, let us not get too excited now, because the relative strength is super important. Therefore, let us look at the trend over the last six months and we can see how Utilities have still been underperforming.
That bounce which we have seen in the month of June is just a little blip at the end of the Relative Strength. If that continues and we continue to see investors rotate to defensive areas like Utilities and in real estate then, we may potentially have some cause to worry in terms of this as an overall indication but, for now it’s still a little bit too early to arrive at a conclusion. With sectors like Utilities and especially Staples that begin to work then could be concerning.
We just want to highlight a candle pattern in the stock INTU or Intuit. We see that the Software group has been one of the strongest. Technology sector or XLK has been incredibly strong, the NASDAQ of course dominating the S&P and also the Dow Jones. On Wed, we had a shooting star candle and all this on its own is not the only thing and whats happening is that, all this is occurring right at a established level of Resistance. Key candle patterns tell us about short-term dynamics,
Resistance levels tell us about longer term levels that are meaningful for this stock therefore, today’s drop could have been anticipated based on yesterday’s shooting star candle.