In Wednesdays market, for the Dow Jones, S&P, and NASDAQ, we saw that, the Mega Cap leader stocks, like semiconductors and others, that have been leading the way higher until now, had actually pulled back a bit on Wed.
Major Indexes Dow Jones S&P NASDAQ Small and Mid Caps
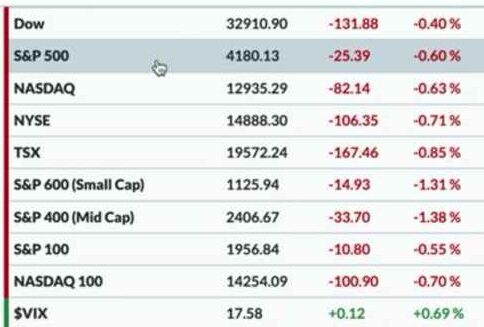
From previous close to Wednesday’s close, the major averages were down a little bit on Wed with the S&P 500 closing around 41.80, that’s down 0.60 percent from previous days close. NASDAQ Composite was also about the same. The Dow Jones was a little bit less, down about 0.40 percent. So the S&P was sort of trying yet again to eclipse that 4200 level, which has been a big horizontal Line.
Coming from the February 2023 high, we keep trying to get above 4200 and one would argue that we trail and fail to stay above that level of resistance. We are back below 4200 on Wed, again closing around 4180. Mid Caps and Small Caps both underperformed. We had about double the downs day with that S&P 600 Small Cap and Mid Cap indexes both down about 1.3 to 1.4 percent.
The VIX and the Markets Dow Jones S&P NASDAQ
The only green on the front page was the VIX Volatility popping a little bit higher, but not by much. It’s still something that we would label loosely as Low volatility. VIX above 20, we would label as more of a Volatile Market and more of a choppy Market environment, like a 2022 type of a choppy downward phase.
A low volatility environment is more like 2021 with nice gentle uptrend, minimal drawdowns, low volatility. The Markets volatility wise have been a little more like 2021 than 2022 now, and again we are seeing the dominance of some of those Mega Cap names that make the Major Indexes certainly move to the upside, without a lot of trouble.
Bonds
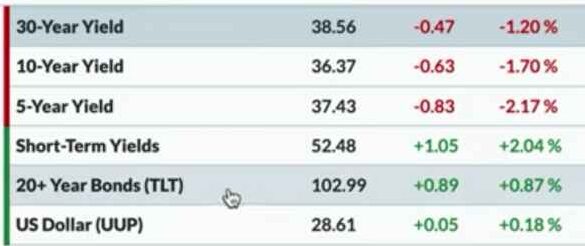
In the Fixed Income Markets, for the most part, the yield curve came down a bit. The 10-year yield which we tend to focus on was around 364 and that’s down a bit from previous day’s close. The long end as well was down to around 386. Bond price is of course moving higher and the TLT was up about 0.9 percent to around 103.
The Dollar Index did not see too much of a change. The dollar might be one of those important charts, certainly to watch as several things have a relative ripple effect and all that we can sort of Trace back to the dollar. For what the Dollar is worth, we had a little bit of an upswing on Wednesday, but not too much.
Commodity
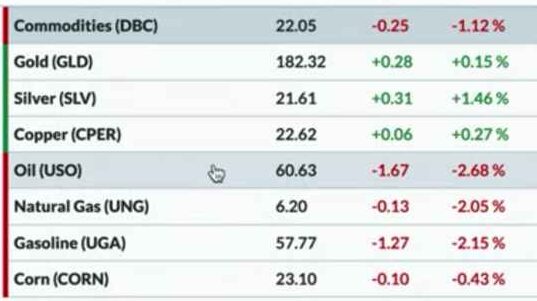
Commodity is a bit mixed and it depends on what area of the Commodity space we are looking at. Energy side like Crude oil ,Natural gas were all down 2-3 Percent. Precious Metals were a little more positive. Silver was the best performer out of this list of 8 commodity ETFs, with the SLV up 1.5 percent. Gold, the GLD was up a little bit 0.2 percent from Wednesday’s close.
Cryptocurrency
Looking at Cryptocurrencies, we saw a lot of red, which is not necessarily a good thing. We saw Cryptos down from about 0,.50 percent to 3 or so, depending on what area we are looking at. Bitcoin and Ether, were both down about 2 to 2.5 percent. Bitcoin’s still above 27000 and Ether now has dipped just below 1900 and this is where we were on Tue, at the close.
Sector Performance – Markets Dow Jones S&P NASDAQ …
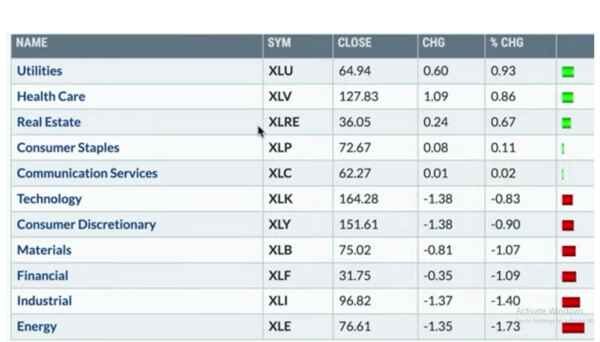
In terms of sector leadership, we can see it was very much defense over offense on Wed and that’s actually been fairly uncommon recently because we haven’t seen defense leading too much recently.
It was sort of the growthy stuff, the Technology, Communication Services that have been leading the way Higher, whilst the other things have been lagging behind. This is a fun show because, for the first time, in quite a few weeks, we can say, the growthy big Fang sectors were not really the story. They are kind of in the middle of the road.
The outperforming sectors on Wed, were the defensive sectors ike Utilities, Healthcare, and Real Estate in 1,2 and 3 position, and Utilities were up almost 1 percent. Therefore there was no huge update, but a decent day in a sector that’s been underperforming recently. At the bottom, we had Energy that was down about 1.7 percent, followed by Industrials that was down 1.4 percent. Financials and Materials both were down just over 1 Percent.
Stock Watch
In the current Market environment, one would definitely look at bond prices as some sort of flight to safety. When we look at the TLT, which is one of the ways we would just like to track general movements around bond prices then, we can see that we are coming out of the lower end of the reign, that we’ve been in for the last six months or so.
After the TLT bottomed out in October, right about where stocks did kind of rallied up to a peak in December, and from there it settled into this General range over the last six months.
Much better than anything else, its the RSI measure of price momentum that really illustrates a range-bound market. On the rallies, within this range, the RSI has rarely got above 60, and on the pullbacks within this range, the RSI has rarely got below 40. That is the definition of a neutral Trend according to a momentum indicator like RSI.
We look for this price to break out of that range and look for the momentum to break out as well. That’s something we have certainly not seen and therefore a flight to safety trade certainly would start to be reflected in something like the TLT. We are not quite seeing it as yet but, we are seeing a bounce off of the lows.
In the Semiconductor ETF, as we look at the unadjusted raw data and just look at the longer term Trend, without including things like dividends, and just look at the actual price behavior, what concerns us is, about stocks like Apple, about stocks like Nvidia, about things like the SMH and many other stocks. All these stocks have been working in a big way over the last six months. A lot of them are trading up to significant resistance. A lot of these stocks have gotten back to their all-time highs from the end of 2021 and beginning of 2022. J
But, just because we’re getting to a new high, is not a wise decision to be selling anything because we need to be aware of where the resistance and the support levels are. Whilst speaking of resistance, Tesla had a decent week, getting above its 200-day moving average, closing above the 200-day, with a nice rally into the close, for the first time since September of last year.
What’s interesting is we’re nearing the 220 point, which is the peak from February. It’s also the first big retracement level, off of the lows in January. Tesla can get above 220 and go much further, but to get to 320 at first Tesla has to get through 220 and let’s focus on how we do, relative to that first level of resistance.