
Image Flickr.com
We had a great week at the New York Stock Exchange for the Dow Jones, the NASDAQ and the S&P and Small and Mid Caps.. As the Fridays closing Bell rang, the debt ceiling worries are over, job numbers are out. Lets Recap last week and see what really moved the markets in the week gone by. We have finally got that break above the 4200 level, that psychological technical level in the S&P 500 that people have been talking about for weeks. We saw the expansion of breadth and we ended on a very high note in the week that ended.
Market Recap – Dow Jones NASDAQ S&P and Other Major Indices
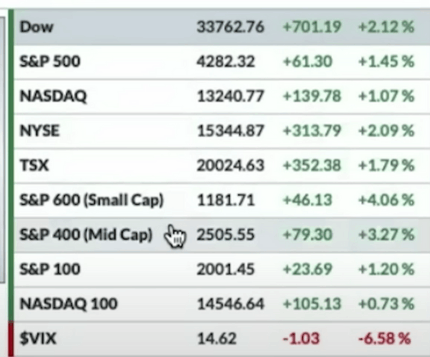
Closing for Last Week Within the equity space, the Dow Jones Industrial Average held a very important 200-day moving average. The Dow Jones wasn’t talked about enough because too many of us were constantly focusing on the S P 500, but the Dow closed up an amazing 700 points or 2.1 percent to close at 33762, on Fri.
We now watch the 34000 because that’s the next level of resistance and Ithere is a feeling that we may be testing that next week. Next of course the S&P 500, that everyone is talking about is the 4200 level, where we got to and also closed above it, last Friday. We had debt ceiling concerns, we also had a three-day weekend. We got through the debt ceiling and we also got through a jobs number and ultimately we got momentum in the S&P 500. It was up 1.50 percent but, was not the leader.
Also, the NASDAQ was up 139 points and had a great day with one percent up, but it wasn’t what led the markets. We saw expansion in the breadth.
The NYSE The Small and Mid Cap
The NYSE index was up 2 percent. The Mid Cap and the Small Cap held another critical level of support and rallied 3 percent on the day and to top it all, the Russell had a great day and the S&P 600 Small Cap index was up another 4 percent. Infact this is what we want to see as we expand and break out to new highs in the S&P 500. The S&P 100 was up 1.2 percent and the VIX is just dragging down by 6.5 and a half percent during the week. We are appreciative of a low VIX because, that means equities are doing well.
Bonds
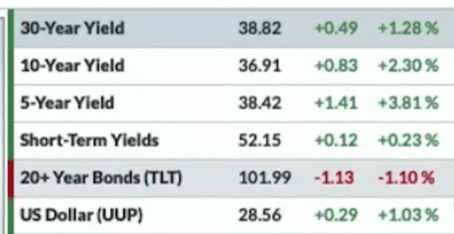
In the bond market, the 30-year was up 1.2 percent, the 10-year yield was up 2.3 percent, the Five-Year yield was up 3.8 percent. However, The 20+ year treasury bonds or TLI was down just under 102, closing at 101.99 and down 1.1 percent. The Dollar you know was pretty resilient and up 1 Percent, closing at 28.56.
Commodity and Cryptocurrency
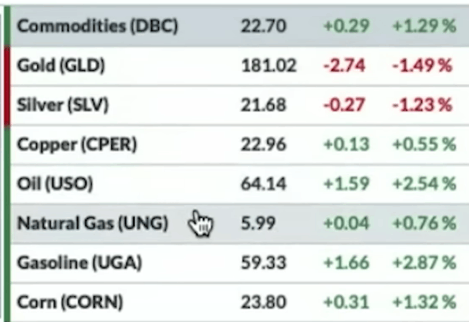
On the Commodities side, the Commodities have been very volatile. Gold in that 200 level, had been something that we thought would break above it but it didn’t. It failed and it was down on Fri. We normally like to see Gold act poorly, especially when the markets and equities are showing strength. Silver was down 1.2 percent, Copper was up 0.50 percent, to almost 23.
Oil bounced off some of those lows and we did get a nice bounce in Energy stocks. Oil led to weigh up 2.5 percent, Natural Gas, a stock that’s personally been killing us is the UNG, closed just below 6 and was almost up 1 percent on Fri. Corn was up 1.30 percent.
In the Crypto space, Bitcoin and Ethereum had nice rallies as well. Bitcoin closed at 27268 and was up 1.65 percent, Ethereum was up 2.50 percent.
Sector Performance – Dow Jones and Other Major Indices
Infact today we will focus on the Market breadth and let’s look at the sector performance. On Fri, Materials, Energy, Industrials led. These were the three of our biggest laggards. It was good to see them come up and lead. When we try to see what failed?, well we see nothing failed. All 11 sectors were up on Fri.
The laggards though on Fri were Communications and Technologies, which were once the leaders. This is healthy Rotation and this is what we want to see.
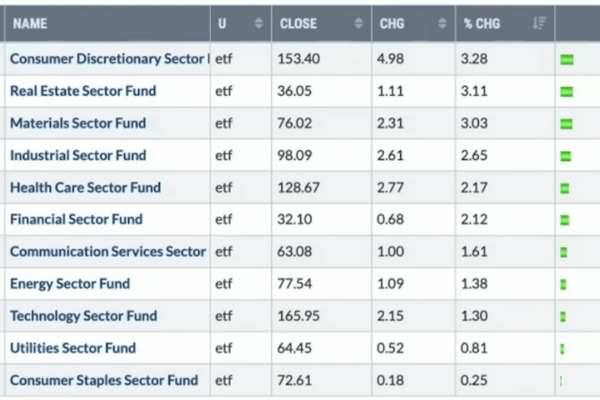
Now, as we look at the week, we saw strength in Consumer Discretionary. Anyways, over the week it was still up 3.3 percent. Real Estate one of the most beaten down sectors was up 3.1 percent, Materials and Industrials up 2 percent. Materials, Industrials, Health Care, financials represent a strong movement and it’s a strong breadth and this is something we want to see in a bull market.
All this while, we all Complained that 10 stocks were leading us this whole time, well let’s see how it continues into next week, but this is what we want to see when we are looking at a sector rotation.
Right now the Transport is one sector that’s not getting enough Attention. The Transports held a key support level here of 13500, broken intermediate short-term downtrend with a nice pop and it poped above key moving averages and this is what we should like the most. We also had a nice Divergence in the RSI revealing that when it was making those lows, relative strength was actually improving this is the kind of things we would want to see.
Next we see the Industrials that broke the relative support with the RSI having a nice little pop on Fri, a nice pop overall of 700 points. We held the key moving averages aswell. It was about a week ago, we had an intraday break of the 200-day moving average.
Stock Watch Dow Jones and Other Major Indices
We take a look at Tesla because that one made a move on Fri. First long-term downtrend was broken in early 2023. We broke it on a nice Gap and we followed through, moving ahead we broke above the 50-day moving average and yes this was important psychologically. This stock then rallied back to its 200-day moving average, a downward sloping 200-day moving average and it failed but, it retraced to a rising 50-day moving average.
Tesla has been very constructive but, to understand if Tesla is overbought right now?, we look at the RSI and we find that Tesla is overbought right now,
On Fri, we saw Tesla has traded four closes above the 200-day moving average, It gapped above all the resistance of those old closing highs. We say closing highs because 217 65 was the high. It closed at a new high going back to last year. This is positive and we may see a retracement over the near term but, it seems something has changed in Tesla you if we add in a little AI phenomenon we may see it rally.
Using our 200-day moving average as a stop, we can probably buy Tesla in tranches, down to it and then watch make it go on a run to 237…240 and then if it really gets going for us then we could be talking about 52-week highs and above,
Next we look at Kathy Woods Arc and its 50-day moving average, 200-day moving average, We broke above these and we closed above, a golden cross is forming. For a long-term investor something has changed. We have done deep Dives under the hood in a lot of these stocks and we have see more stocks in this average do well however, you may argue about Nvidia not being ended in that way and that really stinks because Nvidia missed the big play.
In Kathy Woods Arc, overall we’re starting to see a series of higher lows, we held the 35 level, we broke some minor resistance here at 40 and a half and guess what we’re trending higher and what we like is that, we have a lot to reverse. Will it get us fork again? and we feel that, this Market won’t get us Fork. It feels a little bit this way for now, after we saw the market action on Fri but, Arc is something very good that we see, from a risk rewards point of view.