Markets on Fri. actually opened higher but it got real negative in a very real quick time. In the early afternoon session, it felt like the S&P may not just hit 4100, but may go much further down. There was a sense of consistent deterioration. The S&P was at 4100 around 2 to 3 P.M Eastern Time, on Fri. Dow Jones was mostly flat again.
Market Sentiments Traded on Dow Jones NASDAQ S&P
Usually, in the last hour of trading, we often find a big change in market sentiments and that is because, it is usually in the first 30 minutes and in the last hour of trading, wherein you have a bulk of the volume traded during the trading day.
Early in the morning it is usually a sort of the retail period. This is when there’s a lot of short-term and initial reaction to pre-market announcements, to news flow, to Futures Trading, and all of that sort of things getting started. However, a lot of Institutions, and a lot of ETF rebalancing is always waiting until the last hour of trade. The last hour is therefore more of the institutional hour where a lot of big volume will come in and positions will be made.
On Fri, by means of a simplistic observation about the dynamics of the Day trade, a lot of Institutions again were buying in, going into the close. This however was not enough to push the major averages into the green but, it was enough to make what started to be a real negative Day, to a much less negative day.
S&P DOW JONES NASDAQ BONDS
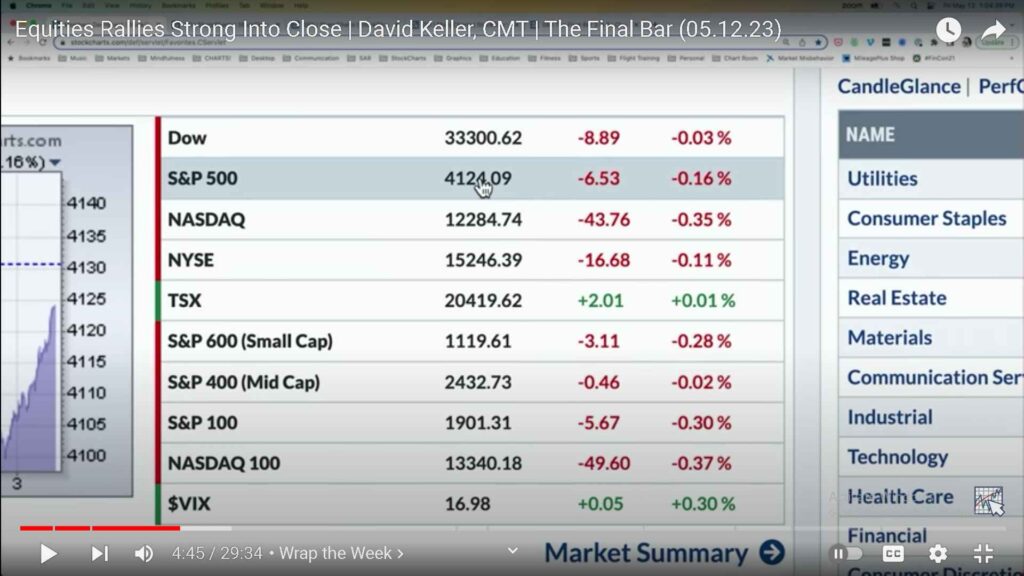
The S&P 500 on Fri, finished down about 0.2 Percent, which was just below 41.25. It did bounce off that 4100 level, to remain above there but, failed to be anywhere near yet, to that 4200 level, in the short term.
The NASDAQ Composite and the NASDAQ 100 both were down about 0.30 Percent. NASDAQ actually under performing the S&P and the Dow Jones was almost flat for the day, right around 33300. Mid cap was also flat. Small Cap was down and was one of the worst performers on Fri, along the lines of the NASDAQ.
The VIX Compared to S&P DOW JONES NASDAQ BONDS
The VIX pushed up just a little bit but it was just the slightest amount. VIX was about the same as where it was on Thu. This VIX is kind of remaining around that 17 level and again well below 20. The VIX being below 20, for a while now, in the last six to eight weeks suggests a low volatility environment.
This is exactly how it feels right now, and it feels like things aren’t moving as much although having said that we see things like FIRST SOLAR stock gapping higher 26 plus percent. In general volatility is certainly a little lighter than average and certainly less than what we would have seen in 2022.

As we look at the interest rates, it was like the entire yield curve coming down. On Fri, a bit of a mean reversion was noticed. Bond prices actually came off, the TLT was down about 0.80 percent and the whole yield curve was sort of moving to the upside. Here the 10-year point which is where we tend to focus our attention often, ended on Fri to around 34.6. Long bond yields was a little bit higher to around 37.8.
Currency
The Dollar pushed higher as Well. Through the course of the day on Fri, we saw Risk Assets a little bit weaker, the Dollar a little bit stronger and the UUP was up about 0.60 percent.
Commodity
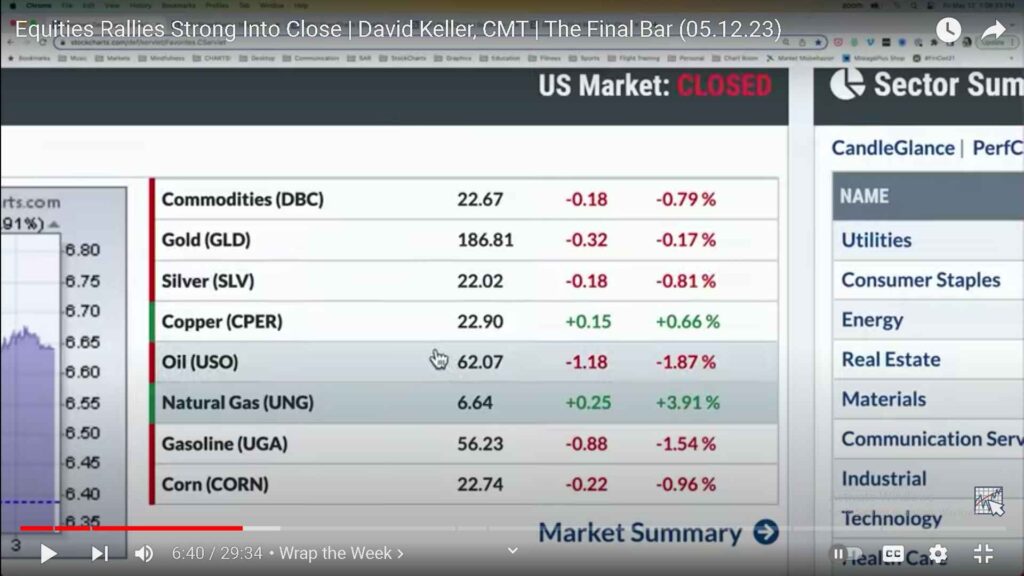
Commodities were sort of a mixed bag but, overall on average a little more negative than positive. The DBC which is a sort of broad commodity ETF was down about 0.8 percent.
Gold and Silver prices were down as well. Gold although was not down too much, Silver prices sort of led the way lower.
Copper price was actually bouncing a little bit higher. Copper had been weaker as of late, so again this was sort of a mean reversion move.
Cryptocurrency
Cryptocurrencies had been getting rough, and a lot of these bounced right into the close of the equity session. This made it look a lot more attractive than it was just a couple of hours ago.
Bitcoin and Ether, both had a pretty rough day, until just that little Spike that we saw going into the last couple of hours of equity trading. Bitcoin was just below 26500, that’s about 2 percent and Ethereum was well below 1800 and down about 0.50 percent from previous days close.
Sector Performance
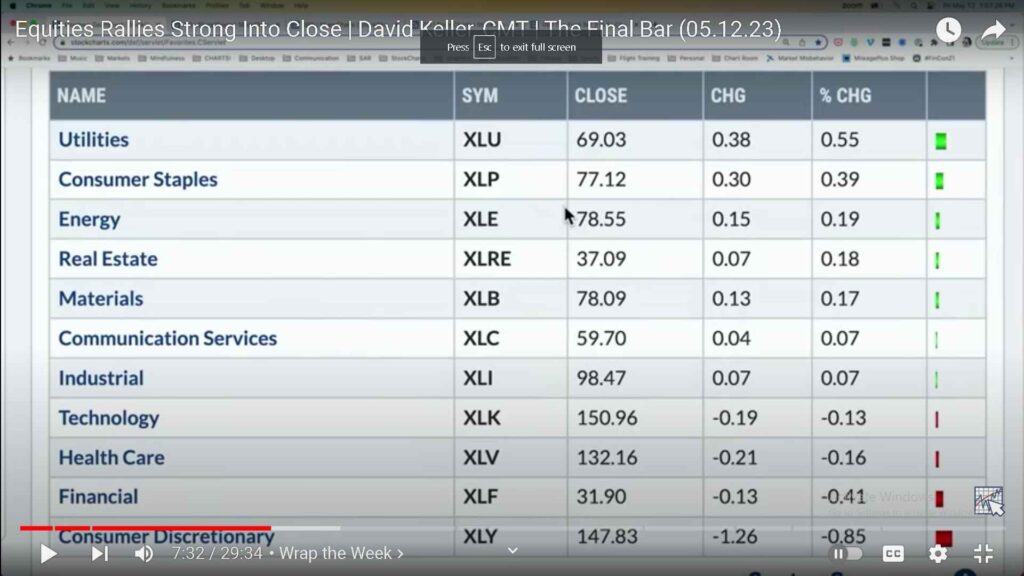
We find that, even though the markets sort of rallied into the close on Fri, it was the defensive sectors like Utilities, and Consumer Staples that were getting the good work done, on a relative basis.
Utilities led the way higher up about 0.60 percent, Consumer Staples was up 0.40 percent. Stocks like Pepsi continue to work up and so does Hershey’s, which has been a stronger stock year-to-date. Therefore we certainly see some potential for a continuous upside in these stocks.
Energy was at number three on Fri, and Energy has been one of the weaker sectors year-to-date on the downside, yet. Consumer Discretionary was actually down 0.90 percent, followed by Financials, which has been really a chronic underperformer in 2022. Healthcare as well was down, but was down by just a slight amount, around 0.20 percent.
Weekly Market Recap
When we see the Weekly performance, the S&P finished the week down about 0.25 percent.
Weekly, Gold underperformed slightly by 0.40 percent. Weekly, In the red, we also have bond prices. The TLT is down 0.60 percent, Small caps is down 1 percent, Crude Oil using the USO was down 1.50 percent. The worst performer here is the Emerging Markets ETF, that is down just over 2 percent.
A couple of things were actually positive on the week. The NASDAQ 100, even with Fridays slight pullback, actually finished the week, up about 0.70 percent. The big winner of the week was the Dollar. The Dollar, during the week was up 1.6 percent. Last year we called the Dollar the wrecking ball for risk assets and this week we are sort of back to that true form, where the Dollar is stronger and a lot of other things are weaker.
Considering Cryptocurrencies, if we do add Bitcoin on the list, then you can see, it was a rough week with the Bitcoin from last Fri, to this Fri, is down about 10.4 percent, over the course of the last seven days.
From the recent Market trends till date, we can say that unless we get above 4200 on the S&P, it’s really not confirming that we’re still in a bull market phase. A bit of a concern is that, while the S&P is holding in near previous swing highs the NYSE is actually in a steep down trend at the moment. A Neutral reading is observed, for the percent of stocks above their 50-day moving average.
On the S&P 500, we see about 48 percent of stocks are almost to the penny, whereas the bullish percent index on the S&P 500 is literally at 50 percent. This means 250 of the stocks are in a bullish point and the other 250 are not. This is a very much the definition of a sideways Market, that is also waiting to see which way we head from here.