
Image by Gerd Altmann from Pixabay
Thursday Market Recap – Dow Jones and Other Major Indices
Today as we look at how the Dow Jones, the S&P and other parts of the market reacted post the FED meeting. We will also comment about the Improvement in breadth conditions and how that is a good thing or a bad thing for stocks, as narrow leadership and the big names continue to do just fine. What’s happening now is that, we see a lot of movements and the Major Averages continue to push higher onward and ever upward as well, eventually having made new highs for the year now.
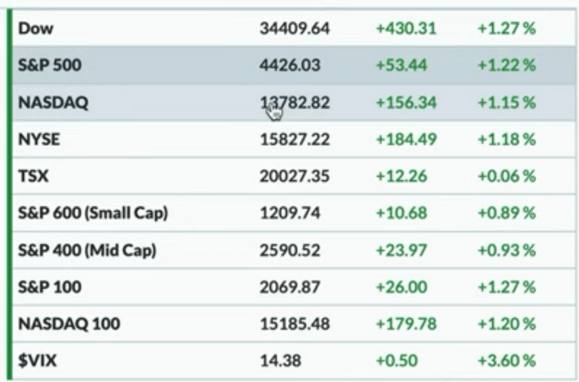
In our Market Recap, as we look at the charts to see what happened with the Major Benchmarks, we could see overall a lot of green on the front page of our Market dashboard. The S&P 500 had a kind of a slow and steady move to the upside through the course of the day on Thu, and finished Higher by about 1.2 percent. That put the S&P around 4426 by the end of the trading day here on Thursday. The NASDAQ Composite and the Dow too were similar and actually all three were about the same, in that 1.2 to 1.3 percent gain. For the day Mid Caps and Small Caps wereup as well. Small Caps lagged behind just a bit but overall we saw a pretty nice move higher.
The Volatility In Dow Jones and Other Markets
Across the board, volatility moved higher. We are generally programmed to think that, stocks going up, means volatility is probably going down and stocks going down means volatility is increasing. For sure, over time and over multiple Cycles this has been the general tendency and there has been this inverse relationship between the S&P and the VIX or volatility. However, Thu was one of those days where we look at individual Stock names and the volatility and we find that, stocks can move higher on increasing volatility, and they can move lower on Lower volatility. Thu was one of those days, where the S&P Moved higher and the VIX actually bounced back higher too, above 14.
Bonds
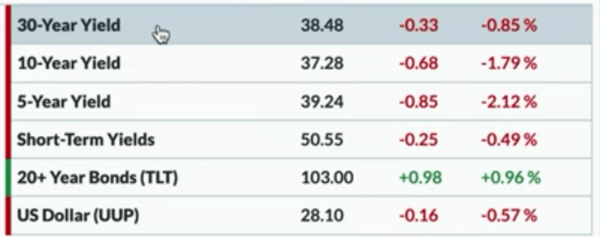
On Thu, Interest rates for the most part moved lower. Of course, we had the FED meeting yesterday, so a lot of investor discussion was based upon what happened at FED meeting and what they learnt or guess about the future path or potential future path of rate hikes or changes in the Target rate going forward. For Thu, Bond markets actually rallied. The TLT was up about one percent, 10-year yields was down to around 373 and long bond yield was around 385. The dollar Index was down a little bit as well, to about 0.6 percent lower for the UUP.
Commodity
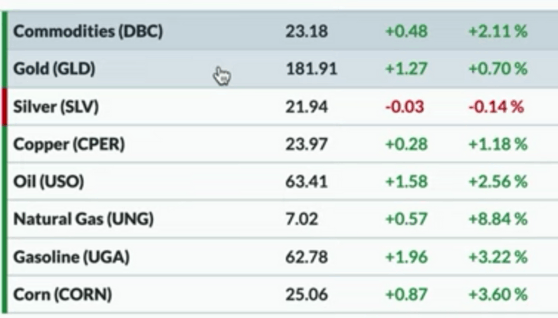
While looking at Commodities, The overall Commodities sheet was in the green. Although, Silver was actually, very narrowly in the red, the GLD of physical Gold ETF was up about 0.7 percent. The broader commodity ETF, like the DBC was all up pretty good as well. Oil prices moved higher. Energy was not the best performer and was kind of in the middle of the pack on Thu but, still up by about 1 percent.
Besides talking about all that narrow leadership and strong performance of the AI fuelled rally in the growth oriented Equity benchmarks, it’s worth talking about cryptocurrencies and the regulatory pressures that these are facing. Of course, we do remember that, day by day there’s a lot of noise in the crypto space and if one wants to find a noisy space then cryptocurrencies are a pretty good place to look because, in it there tends to be a lot of volatility which is much more than the average stock.
Thu, was not too bad of a day and actually we could see Bitcoin and Ethereum both up. Ether prices were up about 1.1 percent, Bitcoin was up about 1.4 percent and some others were having mixed results overall but, both Bitcoin and ethereum attempted to rotate higher. Again there are plenty of challenges to this sort of business model of the cryptocurrency space but again we have always found that, the proof is in the price. When we focus on what the trends and the momentum shifts are telling us, we find that Ether has potentially bounced off of its 200-day moving average.
Sector Performance
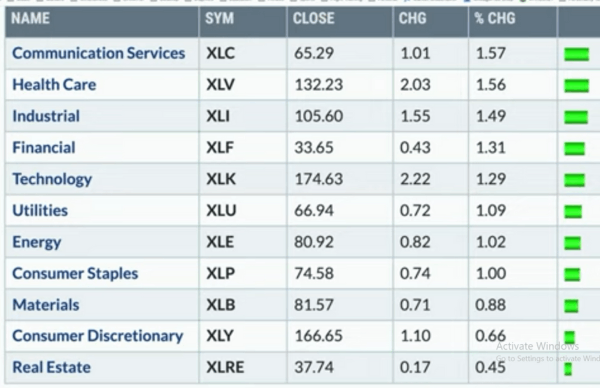
Finally, in terms of sector rotations Communication Services and Healthcare, were pretty much tied for the top performers on Thu. The XLC and the XLV were both up about 1.6 percent, followed by Industrials no.3. At the bottom of the list was Real Estate the fairly defensive sector, and still up about 0.50 Percent. This was followed by Consumer Discretionary and Materials, that was all up at less than 1 percent.
Therefore, what we saw on Thu, was, a clear offense over defense type of read but, not necessarily because it was kind of mixed all around but it was worth noting that all the sectors finished the day higher than they were on Wed. When we talk about a narrow advance that has become more of a broader advance, we would say that this is one of those basic ways to measure that there is a clear message of investors getting more offensive or getting more defensive. A clear indication of rotation between some of those sectors on a day like Thu, can be reckoned with, a sort of move, of rising Tides lifting all boats.
Trend and Stock Watch Over Dow Jones S&P and Other Markets
Considering the QQQ, the NASDAQ 100 bullish percent index, and the bullish percent index for the Technology sector, as we run these bullish percent index data series for the Major Averages and some non-US and some US sectors and for some groups that are the most Meaningful, we found that, the Information Technology sector is right now at around 84 percent.
Over the last 12 to 18 months, we could see that, whenever a sector has gone above 80 percent, that sector was pretty close to have already picked out all of the major turning Points. At this time as well, we see Information Tech having touched all the major ends of the major rallies that we have come across over the last 12 to 18 months.
Though, this is the concern right now again, we would not like to base a strategy that, we have already gone up a lot and therefore, we probably need to go down, now. We think that this sort of a mentality will keep us out of things that have worked and that which may perhaps continue to work for us. In a nutshell, we don’t want to miss out on strong trends that persist but it does tell us to keep an eye on a chart like Information Technology, to look for those rotations lower.
Next, we look at the the relative performance of the Material sector versus the S&P 500. The relative strength on the XLB that is so important, is not turning up enough yet. It’s just started to turn up in the last couple of weeks. We are seeing Materials and even some Energy starting to bounce a little bit but, not enough to really rotate. Materials is therefore, the Sector that we would be watching on a weekly basis to track those moves that we don’t miss, when those things start to really Outperform.