Image by Jonn Doe from flickr.com
Wednesday Market Recap – Dow Jones and Other Major Indices
It was overall a choppy Wednesday with Dow Jones, S&P slightly negative and NASDAQ slightly positive. We could see from most of the stock charts that it was a bit of a choppy day but, at the end of the day a lot of those trends that have been in place continued in the same fashion, while the long side continued to work with names like Apple that was still going up. We tend to get nervous whenever the stocks stop going up and not when they continue to go up and this is our general way of approaching things as a trend follower.
Dow Jones and Major Indices
For our Market recap we’ll start with the Major Equity Indexes. Here on the Major Index list, we see a sort of diversified color palette with red to Green, with some things up while some things down. It wasn’t a huge directional Wednesday and we call this a digestion day where one thinks of the last couple of days as his big meal and now he is sort of sitting back and letting the Thanksgiving dinner to kind of settle in a bit, watching some football on TV perhaps.
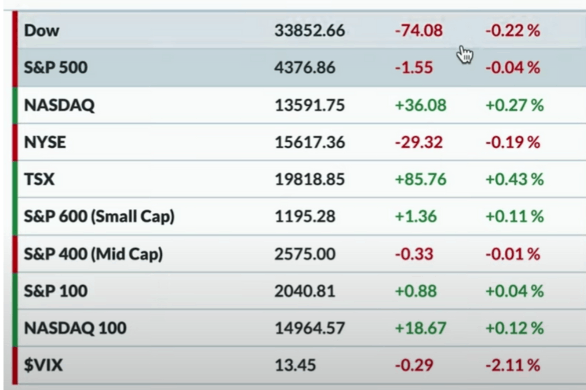
The S&P was essentially flat for the day with a lot of choppiness. Directionally, what actually happened was, well it sort of rallied into the close and at the end of the day it was just below 4380 or around 4377 and that’s literally where we finished the day on Wednesday. Dow Jones was down by about 0.25 percent. The NASDAQ was up by about 0.25 percent.
What’s really interesting is that, if we look underneath the hood and look at some individual names like some Cruise Lines, they were not up in any big way. Also if we look at Consumer Staples like Food Products, they were actually down big on Wed.
Therefore, there was plenty of movement surrounding these General Trends but that’s what we’re just seeing in this short term on Wed. Similar to this was Mid Cap and Small Caps where directionally they did not have a lot to speak of and the NASDAQ 100 was up meagrely about 0.1 percent and therefore not much. What’s interesting is, as we had a sort of lighter directional day meeting us on Wed therefore, we didn’t really move up or down but we moved a sort of sideways.
VIX
The VIX or volatility picture continued to go down. We therefore think that the environment that we continue to be in, is a slow and steady uptrend, that very strongly echoes the 2021 uptrend, with clear leadership, particularly of the Mega Cap growth trade and the corresponding Volatility being fairly low. This asimili can be drawn upon, even though if Volatility has not been extremely low, relative to the last 12 to 18 months which is where we are sort of, in that slow and steady upturn. Now, two things that change here in such a situation is, the Price reverts lower and Volatility increases but, on Wed we did not see any of those signs therefore, there may be a time when this trend would reverse. That reversal trend day wasn’t Wednesday for sure.
Bonds
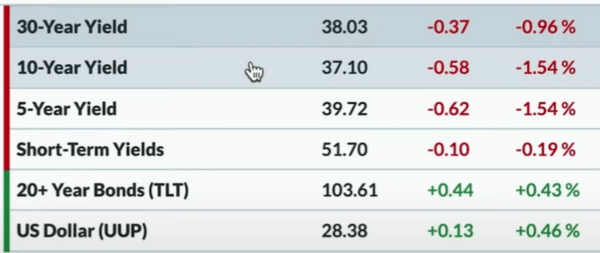
Let’s look at the yield curve that overall moved lower on Wed. We could see the 10-year yield was down just above 3.7 percent, the long bond yield was just above 3.8 percent, the 5-Year yield is back below four percent. We are seeing that overall the yield curve has now come down.
As we have a couple FED meetings, the general expert comments are presently indicating that there is a plenty of appetite for hiking rates and certainly when we have a strong economic data like we saw earlier this week, we feel that certainly gives the FED a license to do whatever and whatever they want to continue to try and slow the economy. For now, yield’s coming off a bit and therefore bond prices are of course going higher in that scenario. The Dollar Index was up by about 0.50 percent from Tuesday’s close..
Commodity and Cryptocurrency
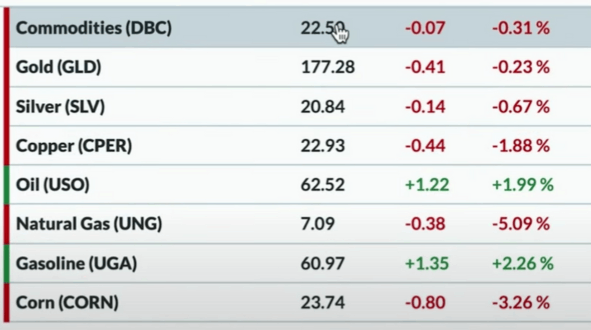
The Commodity space was mostly in the red. Although the Crude Oil prices actually bumped higher and the Energy sector actually had a pretty decent update but, overall the
Commodity ETF DBC was down about 0.30 percent.
Gold and Silver and certainly Copper prices were down as well, so overall we’re certainly continuing to see a rotation away from Gold and Silver. By the way, It’s tough to vote for something like Gold stocks especially when they’ve struggled and therefore when we’re in an environment where they’re just struggling then, we need to really think that, it would be a very different scenario in the next three months to cause a mean reversion to the degree that there may be.
Although that can certainly happen, let’s not count that off for now though. Both Gold and Silver, are at the lower end of a channel and are now breaking below the Channel support.
Cryptocurrency
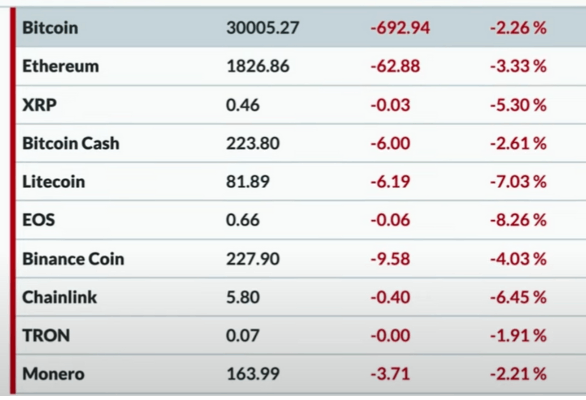
A lot of volatility is seen in the Crypto space therefore, if you’re hungry for Value and if you’re wondering where to go then, Cryptocurrencies probably won’t disappoint you. On Wed, Bitcoin actually pulled back by about 2.25 percent, right above 30000 and that’s a big round number we’ve talked about a number of times. We are very much curious to think about, what the trajectory could be from here. Ether price is just below 1830, that’s down just over 3 percent. Therefore all of the ten most liquid coins that we’re displaying on our list, were down over the last 24 hours or so but, for sure, they are overall within the context of strength that we’ve seen. They are very much off of the lows that we have already seen earlier this year.
Sector Performance
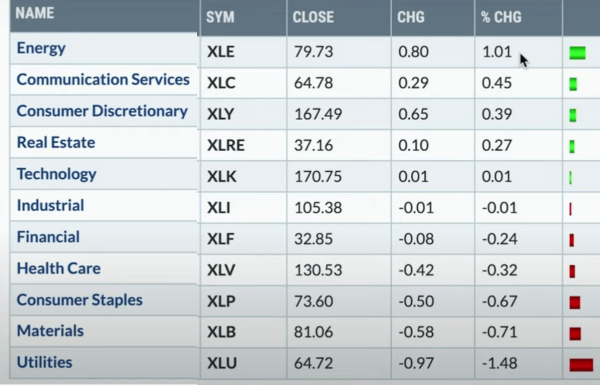
Finally looking at sector movements, we had Energy at the top of the list that was up 1 percent and that isn’t a huge day but, relative to a flat S&P, it is actually a pretty decent update. Again, we think that the charts of Energy stocks and of the Energy sector, still have a lot to prove. These are bouncing off of fairly weak levels, here in the short term this week. Communication Services XLC, Consumer Discretionary XLY were both up about 0.4 to 0.5 percent. On the downside, defensive sector Utilities was down in a big way, about 1.50 percent lower. Materials was down 0.70 percent, Consumer Staples was down 0.70 percent as well.
Whenever we take the Market Top checklist and look at key levels and key patterns that often happen in phases like before, during, and after Major Market tops then, one of the key things happening, particularly in sort of that middle phase is what we call a structural change and that would be a rotation away from the previous leadership into some defensive areas of the market or at the very least into different leadership. That is one thing, we are notably not experiencing yet and it’s still the growth that is in the driver’s seat with particularly the Mega Cap growth stocks.
Things like Energy and Materials, which could work are working in a little smaller ways, but are not really rotating just yet, and defensive areas of the market are still underwhelming as Utilities, Consumer Staples are still doing a lot worse than the S&P. The Relative Strength is going down and so overall we felt more of the same throughout the course of the day on Wednesday.
Trend and Stock Watch Over Dow Jones S&P and Other Markets
No.1, If anybody was to ask us about our take on the S&P then, we would like to have a very simple approach looking at the market Trend. In this approach we often looking at 3 different time frames and then just by doing a simple analysis, we determine whether the trend is positive or negative, with a binary check. At this point, we find that the trend is positive on all three time frames.
The short term is a couple of days to a couple weeks, the medium term is a couple of months, the long term is maybe a year or couple of years. It’s as simple as that and this analysis just looks at that Trend and what’s interesting is as the market tops out, the usual path that this very pretty much always follows is, the short-term model registers a sell signal in that initial rotation and then instead of being a brief pullback it ends up being a little more meaningful and the medium term model turns negative and then eventually if it’s a really dramatic and secular decrease then, the long-term model will turn negative.
At this point when it’s all positive it tells us “be playing this and be thinking of this as a risk on environment, until the market tells us to think otherwise”. At this point we would still consider a sort of thumbs up positive across the board, while again the trend remains strong.
No.2, As we ask ourselves, What ETF performs best?, we had some things like Clean Energy, like Oil and Gas producers, like Gold and then Fang stocks. When we look at the S&P 500 and observe the trend that we’ve seen in the SPY over the last six to eight months. As we compare that to the trend that we’ve seen in the XOP, we see a bounce off of a low level. Although there is a bit of a bounce here but, based on most of our Trend analysis, we would still say that its at best In sort of a consolidation phase, with not enough of a rotation to confirm a new uptrend, just yet. We see that Clean Energy is in a clear downtrend of lower lows and lower highs.
Finally, the Food products Index was one of the worst performers in the Dow Industry Group work on Wed, and probably also in the last week. We would be hard-pressed to come up with an example of something that’s probably underperforming in this space because, if we look at the names that are struggling here then, it’s the US names like General Mills and Campbell’s Soup and Hormel and similar kind of those companies that produce the food, that you have in your pantry.
These are the stocks that are struggling. The Fruit Products group actually just closed below its 200-day moving average on Wed, but the Relative Strength has been deteriorating. Overall, it’s been a weak 2023, but particularly over the last 6 to 8 weeks, we’ve seen a real rotation away from the food product space. We think focusing on the Relative Strength into a group like this, is a really good idea because, when the Relative Strength turns higher then, that’s when it tells us that investors are starting to rotate into those names but, until then these are stocks that are struggling in areas where investors are not rotating and that is not what an uptrend is made of.