
Image by Flickr.com
Tuesday Market brief – Dow Jones and Other Major Indices
On a day like Tue, it was the Small over Large, in a pretty impressive fashion. The IWM in the Russell 2000 ETF was up pretty well, with Small Cap S&P 600 up almost 3 percent and the Dow Jones remaining almost unchanged. Does this mean an end of the dominance of that long old prevailing area of the market?. We don’t think so. It’s a little too early, to maybe make that declaration but, it does tell us that there could be some changes underneath the hood.
Also Tuesdays stock charts were really interesting, as they reflected the rotation into offense, and away from defense. With that as a setup let’s look at the Market Recap and see what we can learn about Tuesdays stock charts.
Market Recap – Dow Jones NASDAQ and Others
It was a kind of a choppy session . We all know that for certain days, the market are more directional, meaning you have a big upswing or a big down day, and usually the story of the day turns out to be a trend that tends to persist the whole day.
Tuesday however, was more about choppiness. At the end of the day the S&P finished a little bit higher, but not by much and it was overall more of a consolidation phase. What is interesting is that, certain parts of the market had actually seen a really strong update.
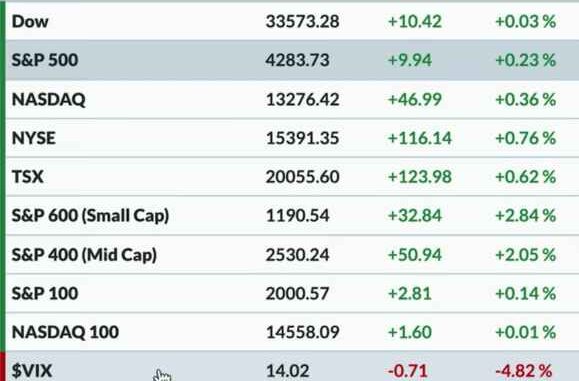
This is evident from the Dow Jones Indl., that was flat from Mondays close, the S&P 500 was up about 0.25 percent to 42.84, the NASDAQ Composite was up about 0.30 percent. The real gains happened a little further, down into Mid Caps, which was up about 2 percent, Small Caps were up 2.8 percent and the only red we saw on Tue is the VIX.
The VIX
The VIX is now just above 14. This is one of the lowest level we’ve seen in 2023. This VIX level trend, really gets us firmly back into the range we were in terms of the volatility way back in 2021. Yes, 2021 does feel like a lifetime ago however, it is noteworthy that, in 2021 it was a slow and steady uptrend that was provided by a fairly low volatility. 2021 was a year where we had minimal drawdowns and the deepest pullbacks at that time were about 3 to 5 percent, and that was about it. Therefore in 2021, it was all about the strength in the market and not just strength but persistent strength with consistent moves to the upside on Lower volatility.
Bond
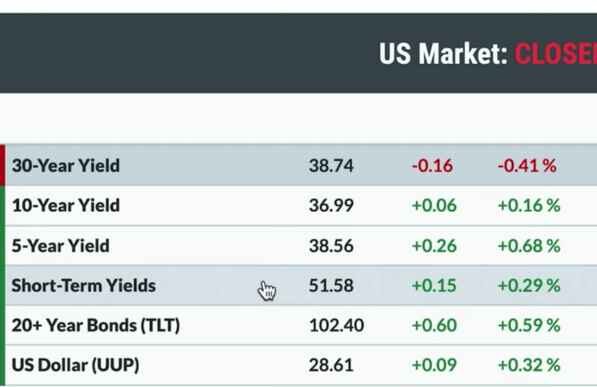
Interest rates overall did not have a ton of a movement from Mondays close. Tenure yield 30-year yield on Tue was more or less unchanged, 10-year yield is still hovering around 3.7 percent therefore, we still have that inverted yield curve but 10-year and 30-year points still around the same levels 3.7 to 3.9 percent. The TLT which we usually use as a proxy for just bond prices was up 0.6 percent. The dollar was up about 0.30 Percent using the UUP.
Commodity
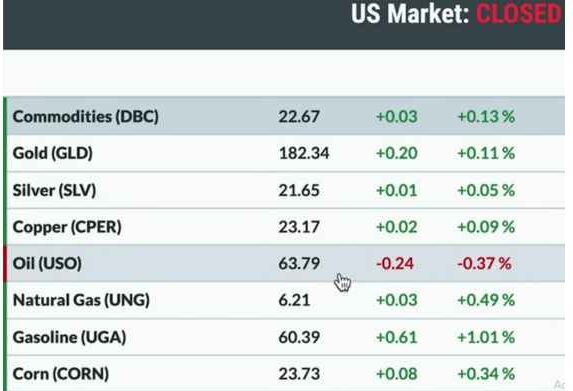
In the Commodity space, we could see Gold and Silver did not have too much of a change from Mondays close. The same can be said for the DBC, which is a broader commodity ETF, with a little more focus into Energy than other areas of the market, but overall we could see a kind of smaller Net positive numbers for most of the commodity ETFs. The Crude Oil ETF USO was down about 0.30 percent but, other than that, it wasn’t too bad of a day and there was not too significant of a movement.
Cryptocurrency
A lot of movement Was seen in the crypto space. Bitcoin is above 27000 to around 27072 and that is up about 5 percent from Mondays close. Ether nearing 1900 was up about 4 percent. We hear a lot of news flow around cryptocurrencies, mostly about Regulation.
As Cryptos were all rolling over today and really accelerating back to the upside, we surely have to expect volatility in this space. Thats a well understood conclusion of assuming a volatility risk and getting into an area of the market like cryptocurrencies.
Nevertheless, overall we see an excessive amount of volatility in the crypto space, relative to what we usually have got ourselves comfortable with, which is relatively low volatility movements.
Sector Performance – Dow Jones NASDAQ S&P Small and Mid Caps
In terms of sector movements, the top three sectors on Tue were Financials, that was up 1.3 Percent. In 2023, amongst all the sectors, very rarely did we have Financials as one of the top performers and amazingly we see XLF having a nice day on Tue. The XLY or Consumer Discretionary was at number two and that was up one percent. Energy was number three and up 0.80 percent.
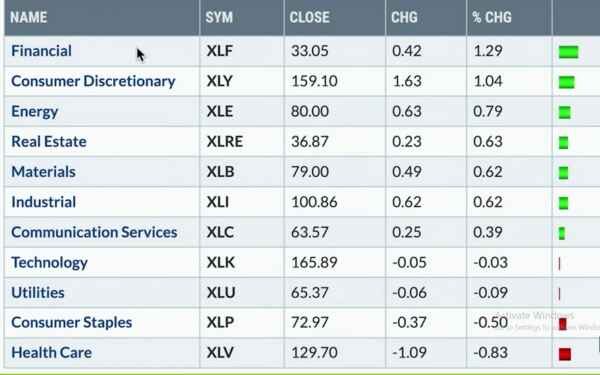
At the bottom we had a couple of other sectors that were down. Healthcare was the worst performer that was down 0.8 percent. Into Healthcare, a number of names like Merck or Boston Scientific were down about 2 to 3 to 4 percent through the course of the day on Tue. This is sort of a give back from Healthcare during a choppy period.
However, Healthcare has not been a great place and it had been pressing on the downside on Tue. Staples was down about 0.50 percent. We had been always talking about offense over defense and on a day like Tuesday, we continued to accentuate the fact when we saw the offense sector like Consumer Discretionary ( things you want to own ) certainly outperforming a defensive sector like Staples ( things you need most everyday ) in the Consumer Space.
Stock Watch – Assets and Stocks In Dow Jones NASDAQ and Other Major Indices
We see that the Regional banks have had a bullish momentum divergence until now. A number of individual stocks that make up the KRE are having a similar pattern. We see a significant drawdown for the Regional Banks in March.
From March, we continued lower in April and up into early May. From May onwards, though we made a low, that low so far, has been the highest low. We made a higher low around 36 dollars in mid of May, followed by another higher low at the end of May and early June, and now we’re rotating higher.
Once again we are back above the 50-day moving average this week. We will be very curious to see if the RSI continues to improve from here. It is very interesting to see that, Regional Banks which have been one of the worst performing groups in the 2023 are now starting to rotate higher, as the relative strength at the bottom of this sector chart really improved further from here.
Finally T-mobile is breaking below the 200-day. whilst testing itself from below, it continued lower and is now in a clear pattern of lower highs and lower lows. The momentum is weak, nearing the oversold condition, the relative strength is negative and this is a stock chart that is in a downfall. Best to avoid charts going down we would say.