We saw a noisy day in the markets On Wed. It was sort of a V-shaped contour to the action on Wed, selling off through the early afternoon, but a nice rally overall into the close, with the S&P and the NASDAQ finishing up in the green and the Dow Jones today in the red marginally.
Markets Today – S&P NASDAQ DOW JONES Today
Wednesdays market dynamics reveals, Market Major averages finished sort of mixed. Although there was a big Improvement in the afternoon hours to push the S&P and the NASDAQ back towards the highs of the day.
The S&P finished today just below 4140 that’s up just about a half a percent from yesterday’s close. Although earlier in the day it was actually in the red but, we saw a nice recovery in the afternoon.
The NASDAQ Composite opened strong, weakened in the middle of the day, and then finished strong, Once Again NASDAQ was up only about one percent, but a nice recovery from early sell-off. This early sell-off felt like, it could have been the investors initial reaction to inflation that was over extended. However, it was a nice recovery for NASDAQ, again finishing near the highs, that was just above 12300.
The Dow Jones was flat and again what you have to remember about the DOW Industrials is that, it’s not really just Industrials but, it’s a mix of sort of Blue Chip Mega Cap names and in that, some of the areas of the Dow are certainly struggling relative to the others.
Mid Caps and Small Caps both up as well but the NASDAQ was the strongest out of all of the indexes
The VIX compared to S&P NASDAQ DOW JONES TODAY
We noticed one of the things in the red today and that is the VIX. The VIX moved back to the downside, back below 17. Now, that’s been sort of a characteristic of the markets in 2022 when we had last witnessed lower market volatility.
Earlier in 2022 we had seen markets sell off and markets overall going into the October low, and then the VIX continued into elevated volatility with the VIX well above 20 for most of the year in 2022.
With the VIX changing only in the fourth quarter of 2022 and carrying forward into the beginning of 2023 and now we have the vix remaining well below 20, and again pushing back below 17. .
Bonds

Next, when we look at some other asset classes very quickly and see where things netted out, The yield curve overall moved down, with the 10-year yield, down 0.8 points to 34.39. The long bond yield just around 37.99. Relative to the rest of the curve, the short end of the yield curve is still pretty elevated.
This is all because of the impact of most recent Federal Rate changes, constantly. The rest of the present overall yield situation is more about the market forces like pricing, future economic growth or stagnation and therefore, overall we could see that the interest rates are pushing to the downside.
When rates are going lower, bond prices are moving higher, and through the course of Wednesday, the TLT finished higher about 1 percent.
Currency
The dollar Index did not see much of a change from Tuesdays close.
Commodity

Into Commodities, again it was a pretty noisy day, all around. Gold actually opened higher. Earlier in the day, it was a sell off then, early afternoon it was basically flat and finally for the day Gold finished a little bit weaker. Overall it was a sort of a lot of noise and at the end of the day,
Gold netted up to not much of a change from the previous days close. Silver prices were a little bit lower. Copper prices were also a much lower.
Energy
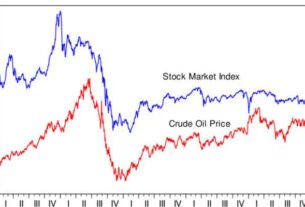
Crude Oil prices were lower as well and the Energy sector was the worst performer out of the 11 S&P sectors here today.
Crypto
Cryptocurrencies again was very noisy. By now, as as we’re going live with this market report, Bitcoin actually was just below 27700. This is pretty much where we were on Tue, at the end of the 24 hour period. It cannot be considered as the close of the day because, Cryptos trade 24 hours. However, just like with currencies, we track a daily closing value, as sort of the daily reset and therefore,
Bitcoin was pretty much flat over the last you know 10-12 hours or so, is how we would describe it. Ether price was also unmoved, holding steady around 1850.
Sector Performances
When we look at the sector movements very quickly then, Technology was number one and was up 1.2 percent.. REITs and Utilities were the second and third top performing sectors. Real Estate and Utilities were followed closely by Communication Services.
At the bottom of the list, four sectors finished in the red and the three at the bottom Energy, Financials, Industrials are a bit of a concern. These are some of the cyclical sectors and what’s interesting is if we dig today for stocks making new three-month highs and three-month lows then, we could see a handful of them in Energy but, a lot of those are not to a new three-month low yet, they’re just sort of trading around just above those lows.
A lot of new lows can also be seen in the Financials, and a bunch in the Industrial sector as well, so we would not be surprised by the end of the day to see those sectors at the bottom of the list as well.
The Markets today, witnessed a rally, finishing stronger as it went into close of day. With Technology leading the way higher, and with some of the Mega Cap names like Alphabet and Microsoft and others doing just fine, this is pushing the NASDAQ Composite arguably to a new swing high for the year, making a new 52 week closing high.
Today however, we could see that the S&P, is not quite there. Right back in late January and early February, both of these indexes made a new swing high and one would argue that is a new DowTheory Buy Signal, where and whenever both the S&P and the NASDAQ make a new swing high. That is a bull confirmed pattern and we don’t have that yet.
Market Observation – S&P NASDAQ DOW JONES TODAY
What we see today is that the S&P needs to get above 4200 basically to break out of this range and to confirm the bull pattern, which has today already been confirmed by the NASDAQ Composite level. if this does not happen for any reason then it would be a bearish non-confirmation that could become concerning pattern especially, if we are bullish and if we are just waiting for the market to go higher.
Stock Watchlist – S&P NASDAQ DOW JONES TODAY
Some of the individual names that were gapping related to earnings was Akamai Technology. Akamai was gapping up to its 200-day moving average. Some of the other stocks, that have been below the 200-day moving average for quite some time is Amazon.
Amazon is a great example stock which has been below the 200-day moving average, for over a year. All of a sudden over the last couple of weeks, Amazon finally got above the 200-day moving average, which could be the beginning of something much more meaningful.
Does Akamai follow suit to Amazon, if it continues to push higher?. It’s all about, if we can follow through on Wednesday’s Gap to the Upside.
To summarise, In the Consumer Discretionary sector, Amazon obviously is one of the biggest weights in the XLY and a widely followed Mega cap name. Amazon had gapped higher on Wed and was up about 3.4 percent.
What’s more interesting to us is the fact that, Amazon is now above the 200-day moving Average. The last couple of times Amazon has closed above or traded above the 200 day was 1.5yrs ago but, Amazon had failed and came back down below this level. What remains to be seen now is, Is this time any different ?, Do we have enough upside momentum to push through .
Finally just like Amazon gapping higher, there are also stocks gapping lower. Airbnb gapped down about 11 percent. Airbnb is the one that we had Earnings but it’s gapped lower. It opened just below the 200-day moving average, and we see that it closed back above it. If we notice, this actually just happened a couple of different times. We’ve traded right down to the 200, after first getting above there in January of this year We’ve had a couple of pullbacks right to that 200-day moving Average.
Do we now hold above there and do we actually hold that as a support level will depend upon the price which is most important to see, if that level will hold. For Airbnb, Do we hold above the April and February lows as well ?, Does the momentum stay strong ?.
As the RSI is pushing lower down to that crucial 40 level, we see that Price goes down below the 200-day moving average. As the RSI goes below 40, however, we observe that this stock did not just gap down then, all of a sudden, otherwise that would have looked like much further deterioration. Therefore this could be an important Stock to watch relative to its earnings release and also relative to some key technical levels.