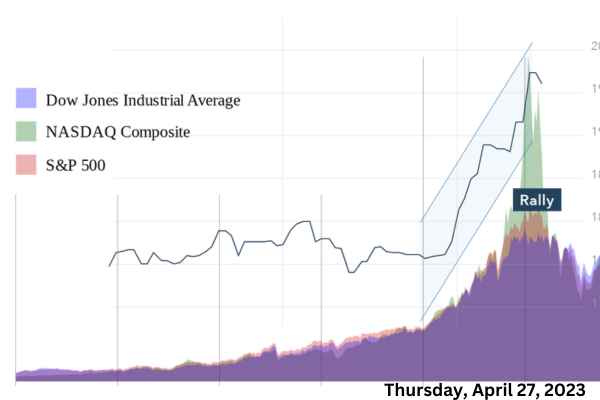
The afternoon session on the last couple of days, prior to Thu was dominated by a Market Sell Off, which obviously investors would not have liked to see. However, Thursdays trading day was a Gap up and a Takeoff. One could see the NASDAQ really Breakout.
Highlights of Stock Market Today – Thursday, 27 April 2023.
Stock Market Today performed as follows.
- The NASDAQ was near Breakout based upon a strong Wall Street day.
- Meta Patforms lead the charge
- ,We’ve seen a lot of Reversals taking place on Thursdays Day Trade.
MARKET RECAP – Stock Market Today – Thursday, 27 April 2023
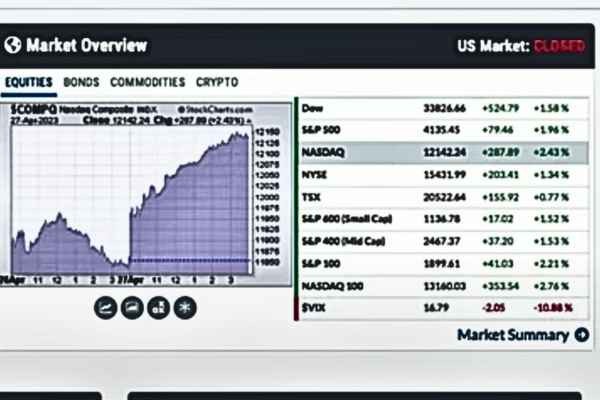
At the end of Market hours on Thu, the Dow Jones Industrial Average was up 525 points, and that was nearly 1.6 percent Up from the previous days close.
S&P 500 did even better climbing almost two percent on Thu, which was up by nearly 80 Points and up over 4100 Level and was back again to that past level of 4135
The NASDAQ was the strongest of them all which was led by Meta Platforms among others. The NASDAQ was up 2.4 percent nearly 300 points Up on Thu, and back to 12142. This is very close to a High for NASDAQ. One could see Buying in the NASDAQ all day long. NASDAQ went right up to a key area of recent price resistance before pulling back right in the final hour of trade, but otherwise it was a very strong day for the NASDAQ.
Small Caps and Mid Caps both played along with the big stocks in the group. Both Small Caps and Mid Caps could be seen gaining a little bit more than one and a half percent.
The VIX on Thu, displayed a 10.9 percent drop, and was at a level that was back down below 17. Investors have been keenly monitoring that 20 level on VIX. With the buying on Thu, the VIX took a pretty big drop.
On the Major Indices list when put together, we could see that in the order of performance on Thu, the NASDAQ 100 was the leader, followed by S&P, DOW and then the Mid Cap and Small Cap. It was worth noting that, even though everything was Up on Performance, but on a relative
basis it could be seen that Mid Cap and Small Caps were not really able to keep Pace with the Others and this needs to be monitored. But until that changes Investors may want to stick with these high market cap companies that are leading the NASDAQ 100.
SECTOR PERFORMANCES FOR THURSDAYS TRADE
Considering the Sector based Performances, we could see the Communications Sector has been the leader for the entire year and also it is back in the driver’s seat.
Again post Thursdays trade, all the aggressive groups, the three of them including XLC( Communication Services), XLY( Consumer Discretionary) XLK( Technology ) were all leading
the charge and that was a good sign for the Bulls.
To the downside, although all the 11 sectors were up but, Energy lagged the most followed by Health Care, Staples, Utilities. it was the defensive groups like Energy, Stapes and Utility that were taking a breather here on Thu. If the Markets do offer a Breakout then, an analysis of Sector based Performance is going to be the the chart that Investors would be keen on watching.
Upon a breakout happening, one would want to keep track of the sectors that are leading on a breakout. Ideally Upon breakout, if its the defensive groups that lead, then Investors maybe have to look at it as a little bit of a red flag.Consequently if its the aggressive groups that keep moving
higher and lead the market, then one would view that very as a bull trend.
Interestingly, if we flip the above based Sector based Performance period to the YTD or Year-To-Date the following could be derived very quickly
- Communication – 24 percent Year-To-Date,
- Technology – 20 percent Year-To-Date,
- Consumer Discretionary – 14.5 percent Year-To-Date,
Every other Sector is way below these above mentioned percentile marks.
Interestingly post Thursdays trade, it wasn’t about one or two stocks within each sector group that lead the rally for that Particular sector but, it was all the top Holding stocks in that sector group that contributed to that particular sectors performance as a whole.
Amongst these aggressive sectors that were leading the Charge on Thu, it could be seen that all the Top holding stocks in Technology were all in the green, followed by all top holding Stocks of Consumer Discretionary in the green and a similar contribution and performance from the Communication sector stocks as well.
We could not really get a whole lot of red stocks until we started moving down into the defensive sectors like Energy, Utilities and Pulses. It could still be seen here that there weren’t a whole lot of red in the these defensive sectors barring Energy which still continued to be the weakest sector having weak performing stocks within its holdings, and they could not perform even during Thursdays impressive Market run.
However on Thu, overall it was a wide participation kind of a move and that’s what one would be glad and wanting to see on a breakout event like this.
10-year Treasury Yield Announcement In Stock Market Today
On Thu morning, the GDP figures were announced and it was less than the expected. In a way we feel that its okay and it’s good news because that’s what the FED wanted as the FED wants to slow down things. The whole problem for dismal GDP could be attributed to the PCE Personal Consumption Expenditure which is still, well above expectations and this unfortunately is an inflationary measure that the FED would likes to watch and control.
In the Stock Market Today, the 10-year Treasury Yield saw a big big boost there up by 10 basis points. This could be because we could see that the bond market was reacting to the inflationary report and Selling Bonds and Selling the Yield up but, it seemed like the stock market was unmoved and paid no real heed to the inflation report. The Stock market were of the view that, since the GDP was
Lower, it could in turn mean lower interest rates down the road and hence, it’s really confusing depends on which side of the fence we would want to be.Interestingly it would be wise enough to prefer a combination of both these as we consider to go forward expecting a favorable turnaround for our present individual situation.
TECHNICAL ANALYSIS – Stock Market Today
In our Marker Recap Report that was published A day prior to Thursdays trade, we expressed our desire to break the ongoing downtrend that was prevailing until Wednesdays trade. We desired to get back through the 20-hour aswell as the 20-day EMA and we successfully achieved that at the opening Bell on Thu, never letting it fade away. On Thu, the QQQ went up all day long until it hit right at resistance. Going forward it is a wait and watch moment to see if the key 321 level on the QQQ could be crossed.
Another big observation was the Semiconductor industry, This is going to be a big big Industry Group to watch here over the coming few days.This industry was seen topping across from 7200 to 7400. This was a break that was above the key resistance and hence it provided a new support level.
STOCKS TO WATCH OUT FOR
Meta Platforms on Thu, displayed big earnings and big gap up. This consequently rendered the Communication Services sector to lead.
Another look at CROX in Thursdays trade saw a lot of buying and there was a lot of
Selling. This stock did recover to some extent in the afternoon session on Thu, but still requires to get back above the moving averages.This is something we have to wait and watch.
Up until now for this week, Investors had experienced a somewhat crazy week. One would have wished that this week maybe have picked up a little bit better. The week through out had seen a lot of selling and on Thu we intermittently saw a big rally and no major breakdowns.
It has to be noted however that despite Thursdays trade being a huge day up there, but there’s really not been any major Breakouts and stocks we’re still within a trading range.Thu was a great day for the investors but they do not think that this is going to continue much longer as its been a confusing Market until now.
A look at some big companies that were supposed to be reporting after the Bell on Thu like Amazon which was seen up eight dollars or eight percent at end of Thursdays day trade. This is a big level for Amazon around 114 and with this earnings if it holds up for a couple of days then we’re going to Gap up and benchmark on another new high.This recent high on Amazon will be good news not only for Amazon but also for the consumer discretionary sector as well.
Another stock to consider in the Stock Market Today is Intel. Intel was actually down after hours by 1.37 percent. Until Wednesdays close of trading hours this stock had witnessed a vague trend it had been showing good trade volume and was able to take out all of the break levels, however all the selling that led into the earnings report kind of confused the Investors and this stock had been down once again till wednesdays after hours but, on Thursday this stock rebounded with a big earning gap but later closed at 1.37 percent lower. Investors are perplexed to know which way this stock is going.
In the Stock Market Today, another stock to look at is FIRST SOLAR. This is one that has really been bucking the trend in the Renewable Energy space.This stock has been on fire. We draw attention particularly to this stock because amongst its peers we saw
ENPHASE struggle after earnings and SOLAR EDGE really been taking a hit and now after the Bell today we got FIRST SOLAR down. However SOLAR EDGE wasn’t down like those other two were when it was last down to 197. If you look at the stock chart of FIRST SOLAR especially all about its recent lows over the last couple of months then we see great prospects for this stock very soon.Hence So this is going to be something to watch very very closely.