After the close on Mon, we break down the activity in the markets using the power of technical analysis and try to navigate market direction. Here we find that we are all collectively scratching our heads about all the different pieces of information, all the different narratives that we’re trying to understand about the market direction that it is trying to embark upon.
As we set the stage for FEDERAL meeting in this week, on Wed, let us debrief on what happened in the Stock Market Today.
At the end of the day what’s really working and what is not working is what our technical analysis is really optimized to help us to try and understand.
MARKET RECAP for Stock Market Today
So today we’re going to get into our Market Recap and we will have a close look today at what’s happening with the S&P and the Major Averages today.
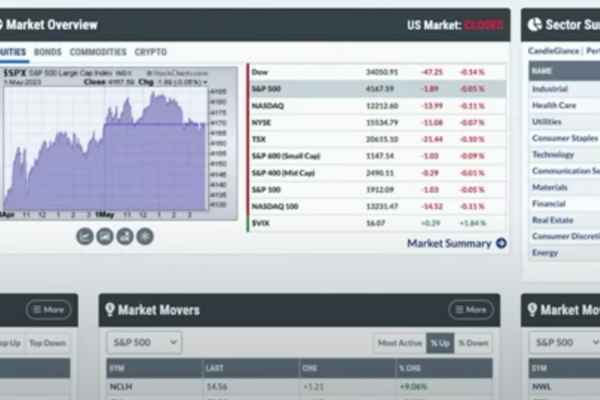
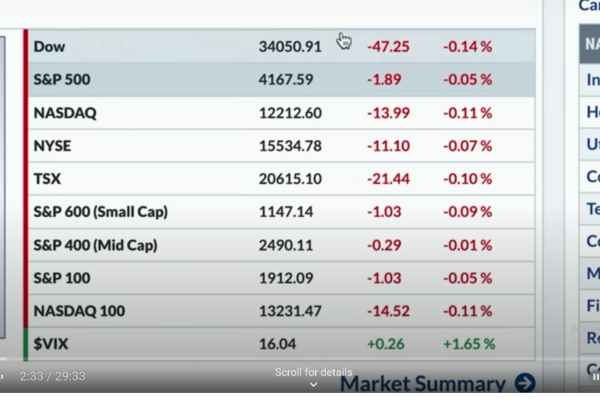
During this very important FED week we could find that a lot of these Major Averages were although in the red but, they were not heavy red. Although the Major Averages did not scale, they were all pretty much green and positive and red negative. We could see that the red negative ones were all just marginal drops below the zero level.
We can therefore say that the S&P, the Dow and the Nasdaq were all essentially only just slightly negative but not by much. The similar pattern was noted with NYSE, TSX, S&P 600 Small Cap, S&P 400 Mid Cap and they all remained more or less the same and almost unchanged.
Note this is quite a pattern everytime especially a couple of days just before a big FED meeting because investors would be trying to understand and anticipate the future path of interest rate hikes.
At the end of the day investors are not making some big rotational bets. Most likely investors will not make some big bets whilst they are just about to get into Wednesdays FED meeting. But, between now and Wednesday, we’ve got some serious earnings happening and those again could move the market but at the end of it all, it’s usually a little bit of lighter sort of wait and see mode.
The VIX in Stock Market Today
The VIX by the way was up a bit, but still really low right down at 16. That is a pretty low level for the VIX when we look at a two-day preview stock trading chart for Thursday and Friday.
Markets are sort of drifting higher somewhat consistently which is interesting, whilst considering all the challenges that are now faced by the Risk Assets, throughout the remainder of this Year.
As we focus on interest rate, we see a rotation from a multi-decade uptrend in bond prices with downtrend in rates but, that reversed arguably a couple of years ago and what we’ve seen so far now, is a rising rate environment and these rates have come off a bit. 10-year yield was up to about four and a quarter and we’re now around 357, so we know that we have got down to around three and a quarter.
Not too long ago we were bouncing up a little bit but, a lot of practitioners argue that this pullback in rates that we’ve seen is a pullback in the larger Trend and therefore it’s almost undeniable that presently we’re in a rising rate environment.
The conditions that we’re in right now can be drawn with a lot of parallels to the situation Now, versus the 1950s 1960s, which is where we were in the last time when we were in a real Rising rate environment and trying to deal with some of these conditions that we’re dealing with right now.
Bond price is of course moving lower when interest rates are moving higher and the dollar Index very notably up about a half a percent. This might be something to watch because when the dollar starts rallying and if and when that would happen then, that usually puts a lot of pressure on things like equities and other assets that tend to thrive when the dollar tends to remain flat or silent.
The S&P 500 in Stock Market Today
In the S&P 500, there was not a lot of upside follow-through with the Energy Space and again that’s interesting because we could see how much of a focus there was, a year ago on Energy in the mid 2022, when we saw Energy doing very well inspite of the other areas of the market that were struggling. But, now we see the opposite and the the Market is sort of rallying at very least in a short-term rally phase, with Energy really struggling to keep pace with the strength that we are now seeing in other areas of the market.
The Bullion Market
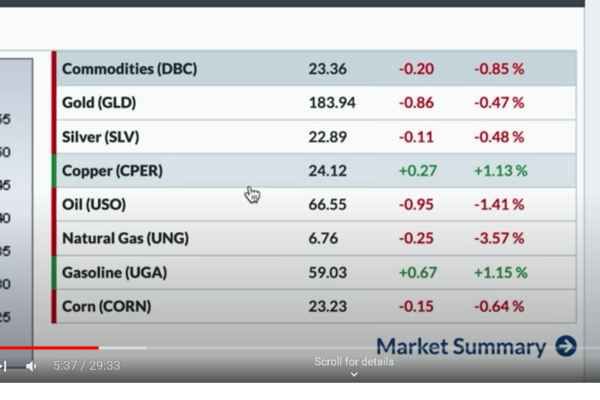
Gold and silver were both down just a little bit today, not too much but about a half a percent. Copper prices were higher, Crude Oil prices still lower and Energy was one of the worst performing sectors today.
Crypto Currency Market
We could see almost all red on the Cryptocurrencies. Bitcoin was down about four and a half percent but, again these trade over the weekend so in terms of the absolute levels, Bitcoin is just below 28 000 and Ether remains just above 1800.
The BreakOuts
In Semiconductors we see NVIDIA making a new high for the year and today it was up another four percent. Its worth noting that, while there’s been this choppy environment, there are areas like Nvidia doing just fine.
LVS is an earnings name this week and was gapping higher, making a new 52-week high again today. Therefore you see that there are areas of the market showing strength, where we’re not necessarily anticipating strength or at least not showing our own follow through.
JP Morgan of course intimately involved in bail out today gapping High and a little bit about two percent but failing to get above resistance. This again sort of characterizes that in a market like this although stocks may trade up to resistance but, they may not trade through the resistance. This is what discourages a investor when they look at performing stocks like JPM.
Someone would describe the current market conditions as a market that has come off quite a bit right and where we’ve seen sectors like Staples, Utilities and Health Care that have certainly started to do very well.
Usually, once the stock market starts to get to the end of a decline and starts to rotate higher towards the end of the decline, that’s when you tend to see Real estate do better. The REITs or Real Estate sector or the XLRE would be the ETF to track. XLRE or IYR are two pretty liquid tests to follow the REIT space. REITs are actually pretty diverse and they cover a lot of different things like Malls and Office space and Residential spaces as well but in the end the XLRE is a pretty good way to track it.
One would be more interested to look out for is, when Technology, Consumer Discretionary Services and Communication will tend to work for them?. It’s usually at the beginning of the big recovery and now how the economic data actually remains negative during that period.
By the way Interest rates tend to Peak right about at this point here when Real Estates are doing well. But, has the 10-year peaked at 425 ? This we don’t know and therefore this is an important visualization to watch out for and to keep an eye upon.
To summarise the story of this Market environment, if we focus a lot on Equal Weighted Indexes and the fact that if we take the mega cap sort of fang trade out of the way then, a lot of stocks are actually not doing particularly well.
The New York Composite Index
The New York Composite Index is a little different configuration and it’s bigger than the S&P and it has more stocks about 2 000 some stocks so it’s a much broader universe and it gets into some of the smaller names but of course not NASDAQ names.
So, whats interesting about the New York Composite Index is that it’s made a low around 14500 here in March and that actually undercut the December low which was a little above around 14900. From there, if we look at how long the NYSC Composite has been below the 15800 to 16000, we find that, the last time we really pushed above 15800 was in late January and early February however, we failed and pulled right back down again.
The question here is are we once again rallying off the March low this time?. The answer is Yes but, again, Are we getting above Sixteen Thousand? if and whenever that happens, then we can be more encouraged about the upside potential for stocks. The fact that this main Benchmark on the NYSE cannot do it causes one to be a little more tentative about upside potential.
We see that the TLT is not breaking out and actually pulling back from resistance, but, the S&P has been pushing higher. Therefore, even with all this uncertainty in stocks, riddled with all the concerns about what’s happening right now, one may ever wonder that, if they can get a decent interest rate in the CD then why they would need income stocks now?.
However, if we look at the relative strength of stocks versus bonds through 2020, 2021, 2022 and now 2023 then, stocks have just overall kept trending higher. It’s been above its 200-day moving average since the middle of 2020, which is not too long after the 2020 low.
Therefore, as long as that remains in place it’s telling us that bonds are just not a great value proposition visa-vis the stability, not even in a pullback phase. Which means one can always expect impressive gains from equities in the form of the S&P 500.
Mid-Cap Stocks
Interestingly, when we take a quick scan on stocks that were able to break out Today, we find that in the Mid Cap Scooter rankings HIMS is one of the top 10 names with about a two and a half billion dollar market cap and doing Telehealth and based in the west coast California.
For this stock, the price is going up and it’s above an upward slope in 50 and 200 day Moving Average and one may feel confident and good when ones portfolio looks like this one in an uptrend market.