
As we wrap the week on a Friday, let us take a look back at the last five trading days and see what we learned overall considering Dow Jones and other Major Index and Risk Assets. It was tough not to be encouraged by the rotation to the upside.
Risk Assets had a nice finish to the week. It was not the strongest Friday, but it was good enough to wrap up a performance that impressed with the upside. It was a week that overall could be described as fairly constructive. The S&P was right up at 4200 and threatening to break above that level, but not quite pulling it off.
Fri Market Recap – Dow Jones and other Major Index
The S&P 500 finished just a little bit below from where we were on Thu. It was sort of a choppy session on Fri. It was obviously a big move on Thu and therefore on Fri, it was sort of licking the wounds day incases where we were short, or maybe we may call it the digestion day as we usually tolerated the day after a big move on Thu. You may often sort of have a digestion day where things try to resettle, and the markets sort of come up with the new values to where the particular stock needs to be and then it’s sort of a recoup and reset and then we see what happens next.
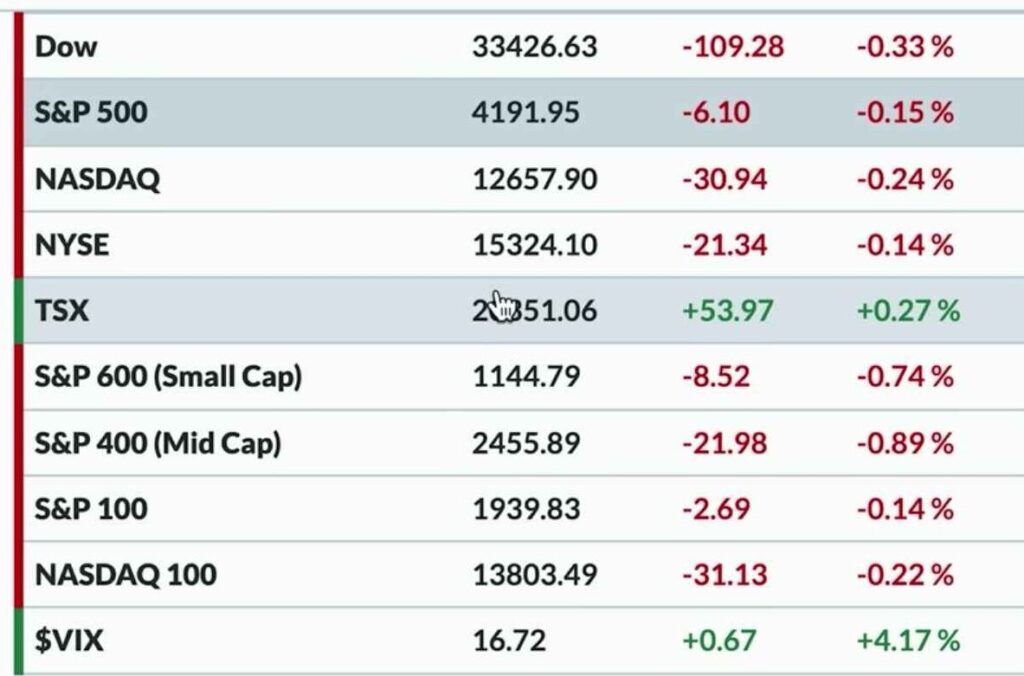
The S&P finished just below 4200 around 4192. This was down 0.20 percent from Thursday’s close. NASDAQ was down 0.25 percent and essentially unchanged
It was a little steeper decline for the Mid Cap and Small Cap indexes. This has been a chronic issue for the markets in 2023. Right after the October off, of the October lows of last Year. 2023 overall has been a resounding success by most definitions for a lot of stocks, particularly for the Mega Cap names. We can look at the S&P 100 as a good example of that. However, Small Caps were much different. We see that the Small Cap ETFs like the S&P 600, Russell 2000 were very different.
Observing the breadth Indicators, whilst looking at Small Cap data, the advanced decline line is much less attractive or we can say much less constructive, as it gives a more of a bearish look than a bullish look, inspite of the nice move to the upside, like the one we saw this week. Therefore, we see a continuous issue for this Market with that lack of support from Mid Cap and especially Small Caps.
VIX
The VIX bounced back higher on Fri. On Thu, we had seen that, when the market rallied, the VIX rotated lower in a big way, and almost got below 16 but, this was not the same case on Fri, and on Fri VIX quite bounced back up to around 16.75.
Bond Market Compared to Dow Jones and Other Market Index
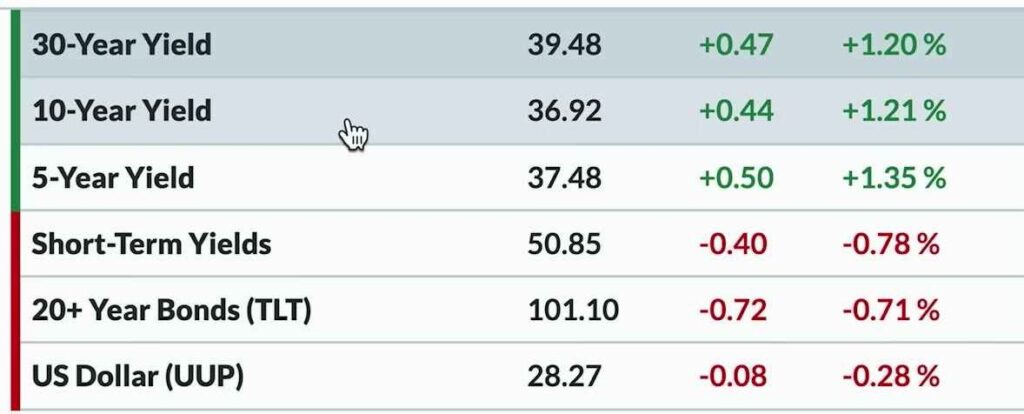
A quick look around some of the other Asset Classes, we see that the yield curve was out of the short end. The Mid to Long end of the yield curve all moved higher once again.10-Year yields finished the week around 369 or 3.7 percent, 5-Year yields around 375 and 30-Year yield around 3.95. Dollar Index was down by 0.25 percent with not much of a change from Thu in the Dollar Index but, that Stronger Dollar had been one of the biggest challenges for Gold prices.
Commodity
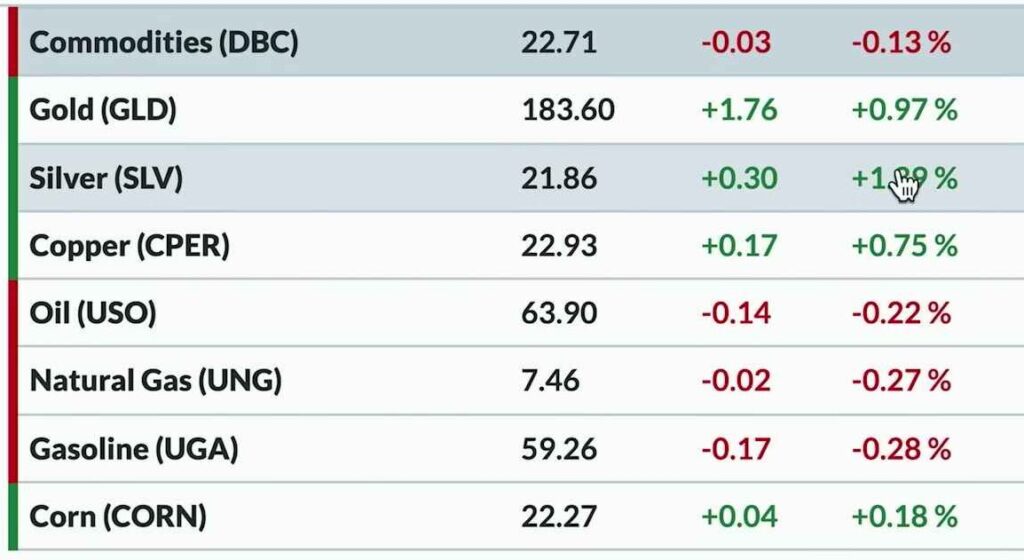
Weaker Dollar on Fri means, gold and Silver have room to move higher and that’s exactly what happened. The GLD was up by about 1 percent, the Silver price was up by about 1.4 percent. The rest was a sort of mixed, like some of the Energy related stocks were down a little bit.
Cryptocurrency
Cryptocurrency was not too bad. On Thu, we had seen a big choppy day for Cryptos but Fri, was a little more reasonable and a little lower in volatility. Bitcoin was just below 27000 and this was not too much of a change from Thu. Ether was around 1810…1815 or so and the rest of the crypto space was sort of mixed, a little up and a little down.
Briefly looking at the stocks of the S&P 500, as we check on what happened with this Market, again we had traded up to 4200 level and closed right there on Thu, but on Fri, we opened and started moving higher and at some point it felt like we can bid goodbye forever to 4200 but, it’s in the rearview mirror and this didn’t really play out that way as we closed back below 4200 level. Also the RSI was right at 60, which is like an indicator that we are in more of a bearish phase.
Sector Performance Across S&P Dow Jones NASDAQ
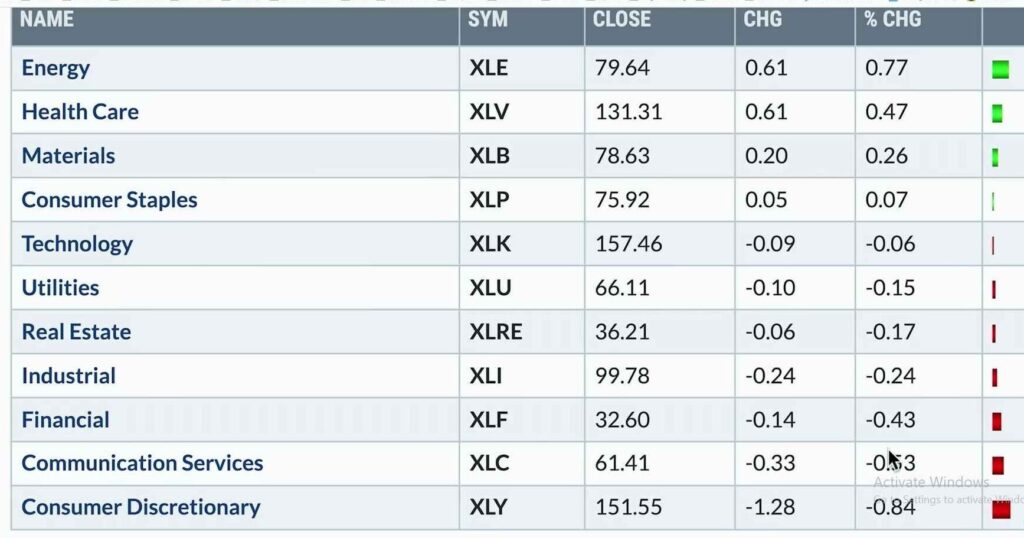
Taking a quick look at the sector returns, Energy was up, Healthcare was up, Materials was up. Energy lead the way higher up 0.80 percent. Everything else was basically flat to down for the day with Consumer Discretionary leading the way lower around 0.8 percent. Now, that is a bit of a mean reversion from what we’ve seen recently in the last week or so. We have often seen in the past, Consumer Discretionary, the Offense sector, outperforming Consumer Staples which is more of a defensive sector but, on Fri, we noticed that flip where Consumer Discretionary was the worst performing out of the 11 sectors.
Weekly Market Recap
Weekly Recap As we look at the weekly returns starting the clock last Friday and comparing the markets to where we are on this Fri, we have S&P 500 that finished this week up 1.7 percent. It was a couple of things that outperformed the S&P this week. It was the Small Caps Russell 2000 that was up 1.9 percent, Crude Oil prices that was up to just about three percent.
The best performer this week was the NASDAQ 100, and was up three and a half percent. Again, this is not a surprise if we have been following the markets in 2023 because that’s how things have been pretty consistently. Everything else underperformed the S&P this week. We hac the Emerging Markets ETF EEM, which was up 1.1 percent this week.
The Dollar finished the week up 0.6 percent. Flat for the week was basically Bitcoin, up 0.2 percent. Gold was down 1.7 percent, Bond price is down 3 percent. Therefore, we see stocks still outperforming bonds, which is usually in a long-term Trend.
The overall Market Trend model remains bullish on all time frames. Long-term Medium-term Short-term were all in the positive last week. The Short-term model this week, just barely remained bullish as it almost went to the negative but, bounced back higher this week. It was again a nice week for Risk Assets which pushed our Short-Term model to reaffirm that it’s in the bullish phase. Short-term, Medium term, Long term gets thumbs up at this point for the markets and that’s certainly what this Market has looked at.
Right now as the S&P is testing 4200, it is worth noting, that the advance decline lines of the NYSE is clearly sloping lower and this is not a look that the bulls will be really excited about. When the market is going higher we want to see the advance decline lines of the NYSE going higher as well.
For now, the S&P and the NASDAQ 100s advance decline lines look fine. However the Issues in S&P are outside of the Mega Cap Technology and Communications stocks. It is the other stocks that are not really performing and we are still seeing that divergence, which is not a healthy divergence. We can check this out by asking ourselves, whether any stock in the S&P is above or below its 50 day moving average and also about the same for the 200-day moving average as well?. Statistics reveal that about 55 percent are in a bullish configuration in the S&P, which means 45 percent are still giving a sell signal.
On our week time frame, it would be a little early for us to declare victory for the Consumer Discretionary XLY sector over the Consumer Staples XLP sector or the Equal weighted versions, but certainly this is something to watch because of the lack of performance in offense sectors in relation to defense sectors has been a concerning development in these markets, recently.
Stock Watch
Netflix is really a fascinating Stock when we think about stocks like Meta, Microsoft, NVIDIA, Google, Alphabet, Amazon, and Apple. We see all eight of them are basically above the 200-day moving average and Netflix certainly is testing its February high and What is very compelling about a market in this phase is the way that the market continues to go higher, you need more and more stocks making a new 52 week high and you need more and more stocks not just trading up to a resistance level but trading through it.
Netflix right now It seems is still testing its February High. When more stocks like Netflix get to this point and then continue further, the more confident we can be about a bull market, having further upside from what we’ve seen so far. However, at this point we are not seeing enough of on Netflix to declare that its happening.
John Deere is one of the few stocks that reported probably the Q2 earnings here at the end of this week. John Deere actually opened up pretty good, just above 390, traded right to its 200-day moving average, almost to the penny and then rotated back lower, ended up making a new low for the year, before closing a little bit above there. This tells us probably that it may be a John Deere specific issue but it certainly tells us about the lack of follow-through. A gap higher in this stock means that investors found a great opportunity to sell and that’s not a great bull market feel for this particular stock.
Secondly, in this market environment, when we see the breadth Indicators, we find a lack of breath Support. As we look at the S&P 500 on a closing basis, we always try to talk about that 4200 level. We have been there but are still a little lower to around 4170 4190.
When we compare this trend to understand the percentage of stocks that are above the 200-day moving average, we find that, in February it was about 80 percent of the S&P stocks that were above their 200-day moving average, then in mid-april it was around 65 62 percent of stocks that were above the 200-day average and currently as the S&P is now breaking above that trend line and testing 4200, it’s at 50 percent stocks.
Every time when we have tested this 4200 level there have been less and less members of the S&P that were above their 200-day moving Average. This is not an encouraging sign Because a rotation higher in the market should be matched by a rotation higher in breadth indicators, otherwise we may have to worry about a lack of breath support and this is very much a concern here in May of 2023.
Considering Netflix, it’s not just the S&P testing 4200 but, it’s a lot about those individual stocks and sectors and groups that are testing resistance as well. The stock of Netflix shows a peak in February to around 370, then we can see it pulled back of course in March, we made a higher low in April and that’s pretty constructive but now we are retesting that level as far as Netflix is concerned. We are super encouraged that we had a round trip from the low in March, back to the peak in February but, it remains to be seen whether or not we get through there.
As we test resistance it’s all about the follow through that we would be hoping for.. We can definitely put in a watch list and start to review stocks like Netflix over time and set price alerts on them to know when these actually do break above that key level. We may decide to have an alert for Netflix at 375.
Finally stock that we review is ULTA Beauty and while the S&P is breaking out, while Netflix and stocks like it are testing resistance, there are other stocks that don’t look like that and I think that’s one of the most interesting Parts about looking at equities and looking at ETFs.
It’s not just about the S&P or the NASDAQ and the high level indexes but, it’s also about the individual names that comprise those indexes and if there have been outliers to the upsides that are breaking out, there have also been outliers to the downside that are breaking down. We can find plenty of stocks making new three-month highs and plenty of stocks making new three-month lows as well. ALTA is one of those making a new three-month low this week. It broke below 500 and that takes us below the March low and that’s after failing to eclipse the March and April highs.